Candlestick Encyclopedia
The complete guide to reading candlestick patterns. 52 patterns explained in plain English.
Introduction: How to Read a Candle
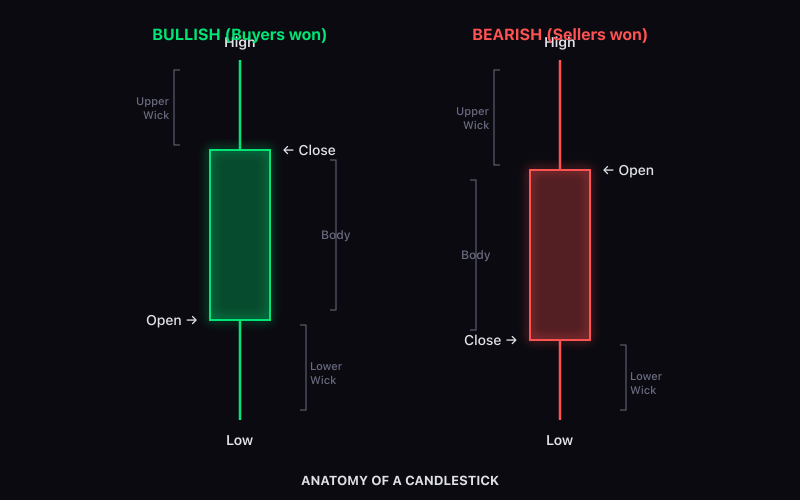
Every candle on your chart tells a story about a fight between buyers and sellers during that time period (1 hour, 4 hours, 1 day — whatever your timeframe is set to).
The four data points:
- Open = where price started when the candle began
- Close = where price ended when the candle finished
- High = the highest price reached during the candle
- Low = the lowest price reached during the candle
The body is the thick part between open and close:
- Green/white body = close is ABOVE open (buyers won)
- Red/black body = close is BELOW open (sellers won)
The wicks (also called shadows) are the thin lines above and below the body:
- Upper wick = price went up there but got pushed back down (sellers resisted)
- Lower wick = price went down there but got bought back up (buyers defended)
Part 1: Single Candle Patterns
Doji
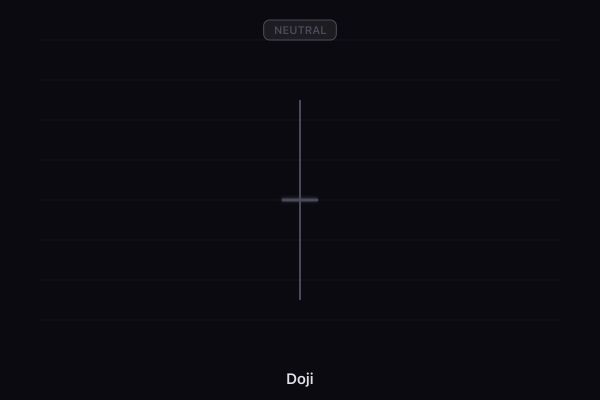
What it looks like
Almost no body — open and close are at nearly the same price. Small wicks on both sides.
What it means
Perfect indecision. Buyers and sellers are exactly balanced. Neither side won.
Where it appears
After a strong move in either direction. It's a warning that the trend might be losing conviction.
How to trade it
Don't trade the doji itself. Wait for the NEXT candle to tell you which side wins.
Tip
A doji after 5+ strong green candles is more significant than a random doji in a choppy range.
Long-Legged Doji
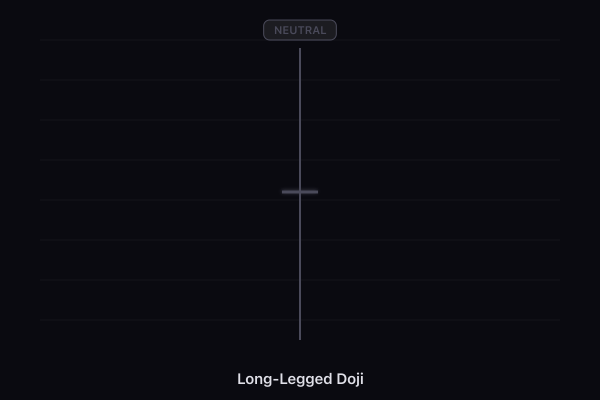
What it looks like
Tiny body with very long wicks on both sides.
What it means
Price swung wildly in both directions but ended up right where it started. Extreme indecision — both sides tried hard and both failed.
Where it appears
Often at major turning points after volatile moves.
How to trade it
Signals a potential reversal but needs confirmation. The long wicks tell you the battle was intense.
Tip
The longer the wicks, the more significant the indecision. Look for follow-through on the next candle.
Dragonfly Doji
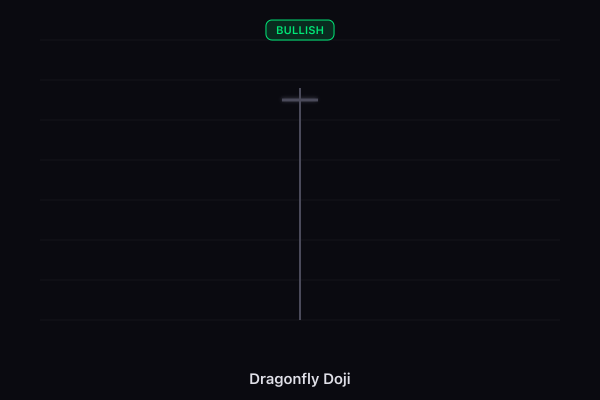
What it looks like
Open and close at the top, long lower wick, no upper wick. Looks like a "T".
What it means
Sellers pushed price way down during the candle but buyers fought back and pushed it all the way back up to the open. Buyers won decisively.
Where it appears
Bottom of a downtrend. After a selloff.
How to trade it
Bullish signal. Buy on the next candle if it confirms (closes green above the dragonfly).
Tip
The longer the lower wick, the stronger the bullish signal — sellers tried harder and still lost.
Gravestone Doji
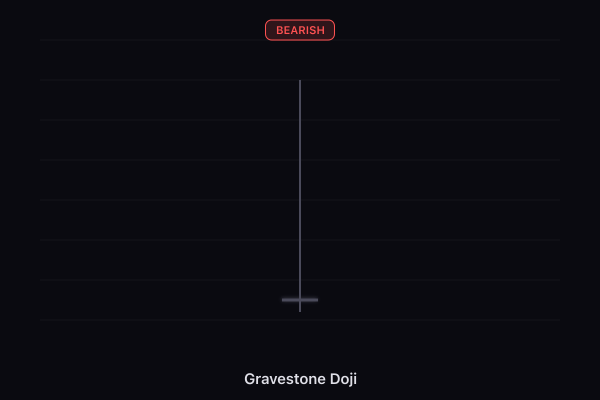
What it looks like
Open and close at the bottom, long upper wick, no lower wick. Looks like an upside-down "T".
What it means
Buyers pushed price way up but sellers smashed it right back down. Sellers won decisively.
Where it appears
Top of an uptrend. After a rally.
How to trade it
Bearish signal. Sell or short on the next candle if it confirms (closes red below the gravestone).
Tip
If it appears at a resistance level from Auto Trendlines, the signal is much stronger.
Hammer
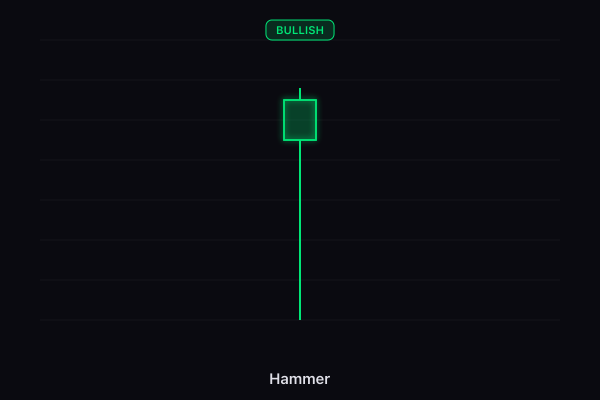
What it looks like
Small body at the top, long lower wick (at least 2x the body), little or no upper wick.
What it means
Sellers pushed price down hard, but buyers stepped in and pushed it back up near the open. The bulls are defending.
Where it appears
Bottom of a downtrend. The longer the preceding decline, the stronger the signal.
How to trade it
Buy when the next candle closes above the hammer's high.
Tip
A hammer with higher-than-average volume is much more reliable. Check Smart Money for confirmation.
Inverted Hammer
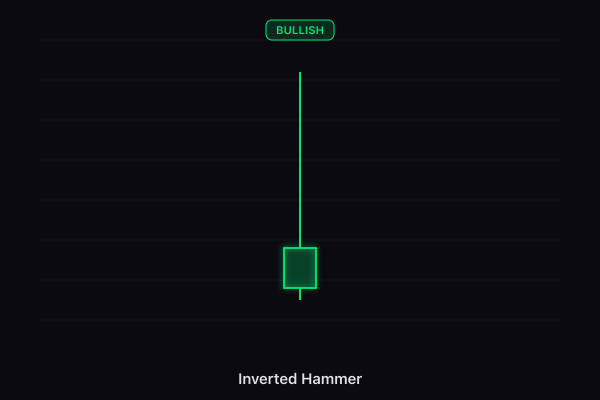
What it looks like
Small body at the bottom, long upper wick, little or no lower wick.
What it means
Buyers tried to push price up (upper wick shows the attempt). They didn't fully succeed, but the fact that they're trying at the bottom of a downtrend is a sign of shifting sentiment.
Where it appears
Bottom of a downtrend.
How to trade it
Needs strong confirmation — the next candle must close above the inverted hammer's body.
Tip
Less reliable than a regular hammer. Always wait for confirmation.
Hanging Man
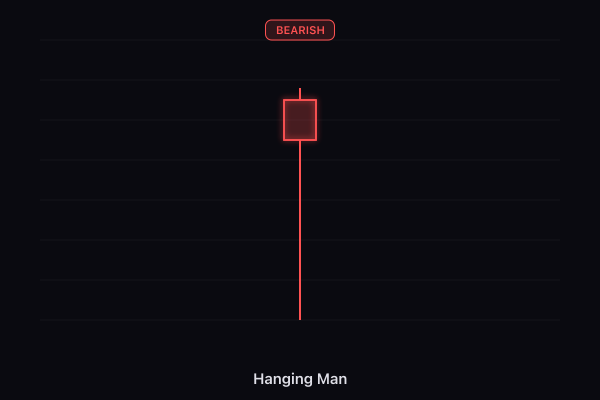
What it looks like
Identical to a hammer — small body at top, long lower wick. But it appears at the TOP of an uptrend.
What it means
Same shape, opposite context. Sellers appeared and pushed price down significantly during the candle. Buyers recovered, but the fact that sellers showed up this strongly at the top is a warning.
Where it appears
Top of an uptrend.
How to trade it
Wait for the next candle to close below the hanging man's body to confirm.
Tip
Context is everything. Same candle shape = bullish at the bottom (hammer), bearish at the top (hanging man).
Shooting Star
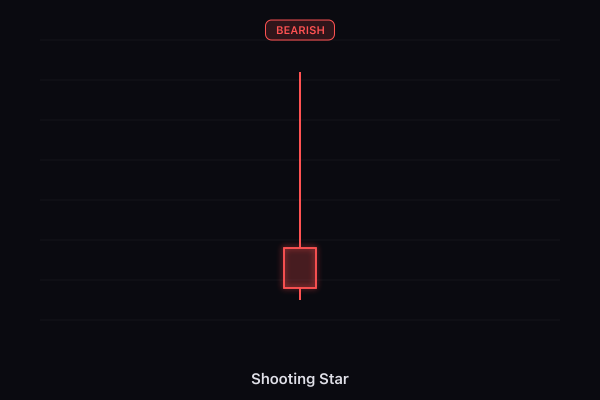
What it looks like
Small body at the bottom, long upper wick (at least 2x body), little or no lower wick.
What it means
Buyers pushed price up aggressively, but sellers overwhelmed them and pushed it right back down. The rally was rejected.
Where it appears
Top of an uptrend.
How to trade it
Sell or short when the next candle closes below the shooting star's body.
Tip
A shooting star at a resistance trendline is one of the most reliable single-candle signals.
Bullish Marubozu
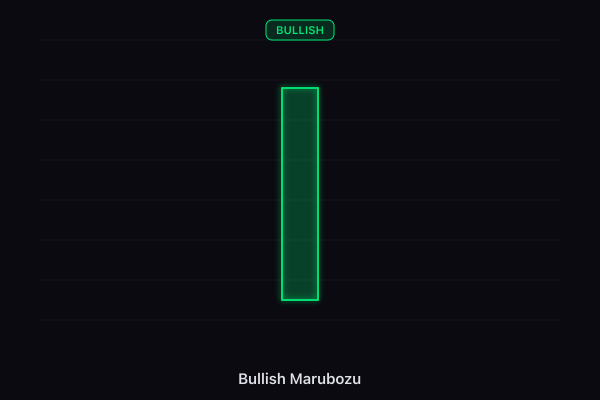
What it looks like
Full green body with NO wicks at all. Opens at the low, closes at the high.
What it means
Buyers dominated from start to finish. There was no moment where sellers had any control. Pure buying pressure.
Where it appears
Can appear anywhere. Often marks the beginning of a strong trend.
How to trade it
Very strong continuation signal. If it appears after a breakout, the move is likely to continue.
Tip
Rare in crypto because of wicks, but when you see one, respect it. The conviction is maximum.
Bearish Marubozu
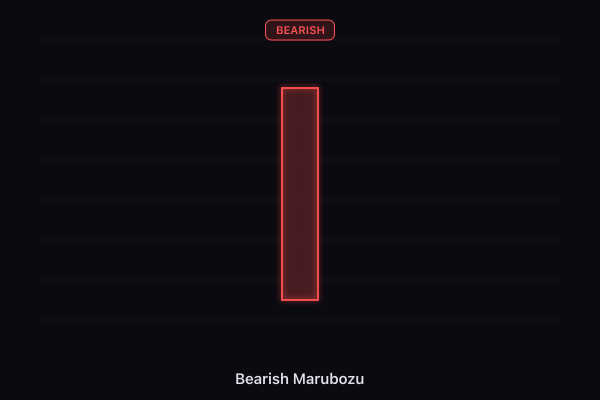
What it looks like
Full red body with NO wicks. Opens at the high, closes at the low.
What it means
Sellers dominated completely. Not a single moment of buyer resistance.
Where it appears
Anywhere. Often marks panic selling or the start of a crash.
How to trade it
Strong sell signal. Don't try to buy the dip on a marubozu.
Tip
If Smart Money shows distribution AND a bearish marubozu appears, the move down has legs.
Spinning Top
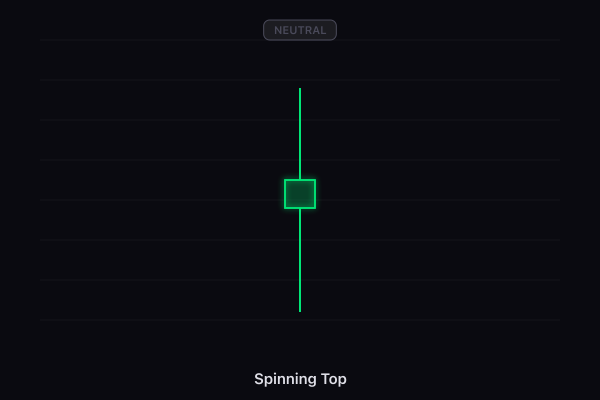
What it looks like
Small body in the middle with moderate wicks on both sides.
What it means
Some back and forth but no clear winner. Mild indecision.
Where it appears
Anywhere. Common in ranging markets.
How to trade it
On its own, means nothing. But after a strong trend, it can signal the trend is losing momentum.
Tip
Multiple spinning tops in a row = the market is stuck. Wait for a breakout.
High Wave
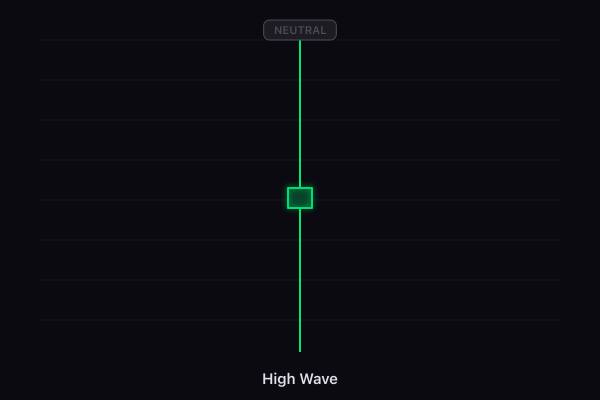
What it looks like
Like a spinning top but with much longer wicks. Tiny body, huge wicks both directions.
What it means
Extreme volatility within the candle but no resolution. Both sides went all-in and both failed.
Where it appears
Often near major turning points. The market is "deciding."
How to trade it
Don't trade it directly. It's a red alert that something big is about to happen. The next 1-3 candles will tell you the direction.
Tip
Check Volatility Regime — you'll often see this during elevated or extreme regimes.
Bullish Belt Hold
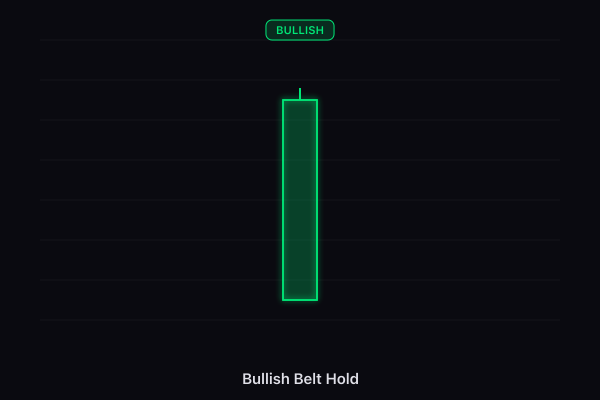
What it looks like
Long green body that opens at its low (no lower wick) with a small upper wick.
What it means
Buyers took control from the very first trade and never gave up ground. Strong opening statement from bulls.
Where it appears
After a decline or at support.
How to trade it
Moderately bullish. More reliable when it appears at a support level.
Tip
If the body engulfs the previous candle's body, treat it as a bullish engulfing (stronger signal).
Bearish Belt Hold
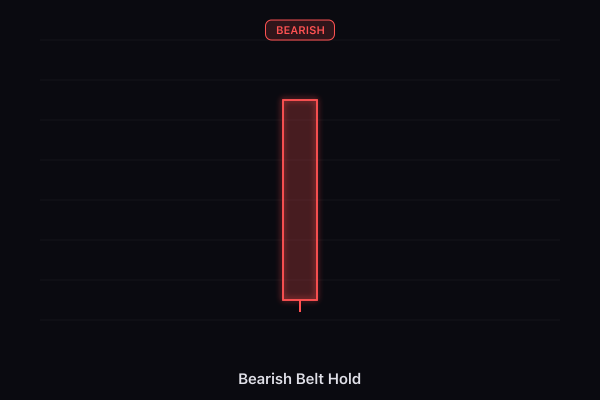
What it looks like
Long red body that opens at its high (no upper wick) with a small lower wick.
What it means
Sellers took control immediately and never let buyers back in.
Where it appears
After a rally or at resistance.
How to trade it
Moderately bearish. Watch for follow-through.
Tip
At a resistance trendline, this becomes a high-probability short signal.
Long Lower Shadow
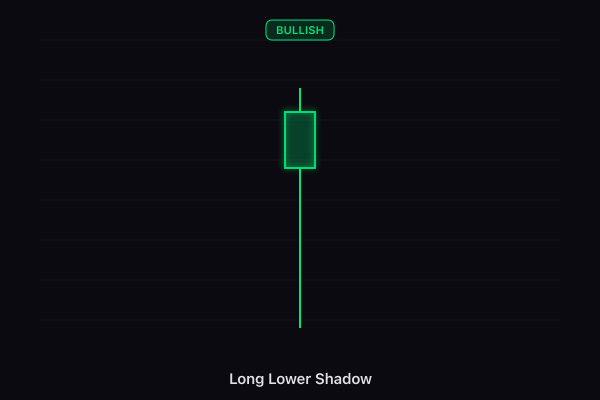
What it looks like
Any candle (green or red) with a lower wick that's at least 2x the body size.
What it means
Sellers tried to push down but buyers defended strongly. Even if the candle closed red, the long lower shadow shows buying pressure.
Where it appears
More significant at support levels or after declines.
How to trade it
Watch for continuation in the direction the wick suggests (buying pressure = potential bounce).
Tip
TradeOptics's Bar Analysis Report calls this "LOWER-HEAVY" wick pressure — same concept.
Long Upper Shadow
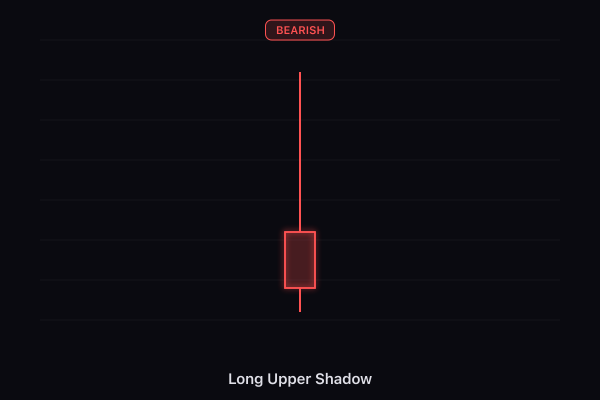
What it looks like
Any candle with an upper wick at least 2x the body.
What it means
Buyers tried to push up but sellers rejected them. Selling pressure from above.
Where it appears
More significant at resistance levels or after rallies.
How to trade it
Watch for a pullback. The rejection from above suggests sellers are active at that price.
Tip
Bar Analysis calls this "UPPER-HEAVY" wick pressure.
Part 2: Two-Candle Patterns
Bullish Engulfing
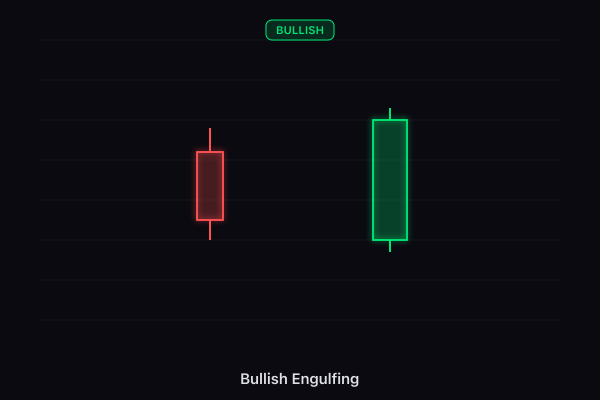
What it looks like
A red candle followed by a larger green candle whose body completely covers ("engulfs") the red candle's body.
What it means
Sellers had control (red candle), then buyers overwhelmed them so completely that they erased the entire previous candle. Power shift.
Where it appears
Bottom of a downtrend.
How to trade it
One of the most reliable reversal signals. Buy on the close of the engulfing candle or on the next candle.
Tip
The bigger the engulfing candle relative to the previous one, the stronger the signal. If volume is high, even better.
Bearish Engulfing
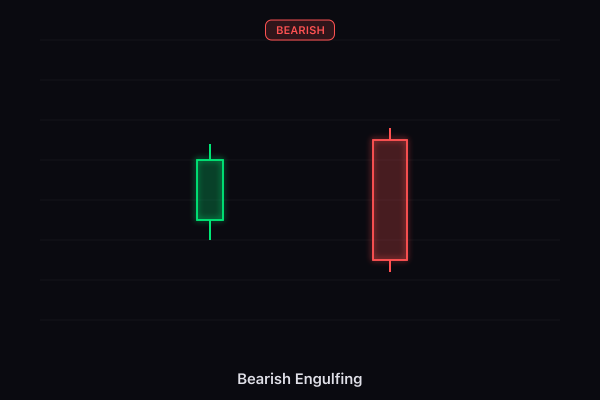
What it looks like
A green candle followed by a larger red candle that completely engulfs the green body.
What it means
Buyers had control, then sellers took over completely.
Where it appears
Top of an uptrend.
How to trade it
Sell or short on the close of the engulfing candle.
Tip
At a resistance trendline with the Exhaustion gauge above +50, this is a high-probability top.
Piercing Line
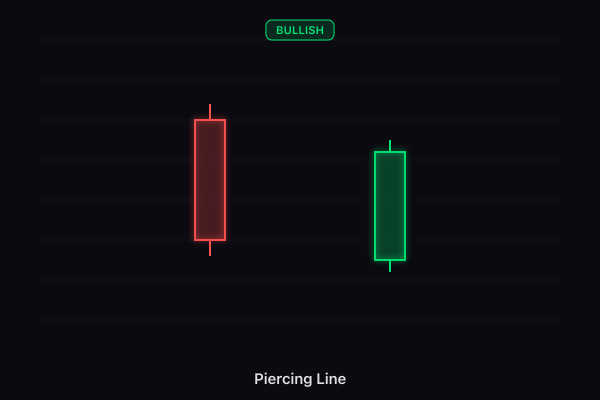
What it looks like
A red candle followed by a green candle that opens below the red candle's low but closes above the MIDPOINT of the red candle's body.
What it means
Sellers pushed lower (gap down on open) but buyers fought back hard, recovering more than half the losses.
Where it appears
Bottom of a downtrend.
How to trade it
Buy on confirmation (next candle closes above the piercing candle).
Tip
If the green candle closes above 60-70% of the red candle (not just 50%), the signal is stronger.
Dark Cloud Cover
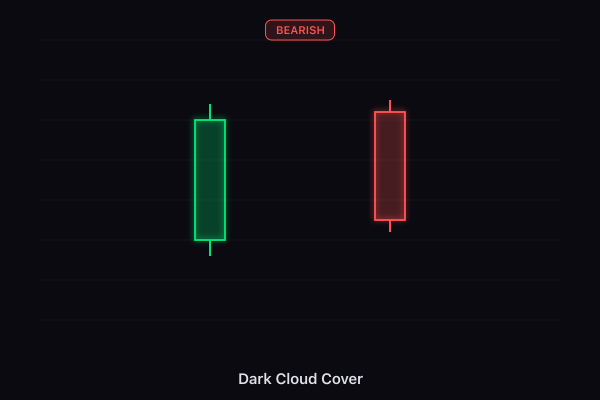
What it looks like
Opposite of piercing line. A green candle followed by a red candle that opens above the green's high but closes below its midpoint.
What it means
Buyers pushed higher but sellers overwhelmed them, erasing more than half the gains.
Where it appears
Top of an uptrend.
How to trade it
Sell on confirmation.
Tip
This is the bearish mirror of the piercing line.
Tweezer Top
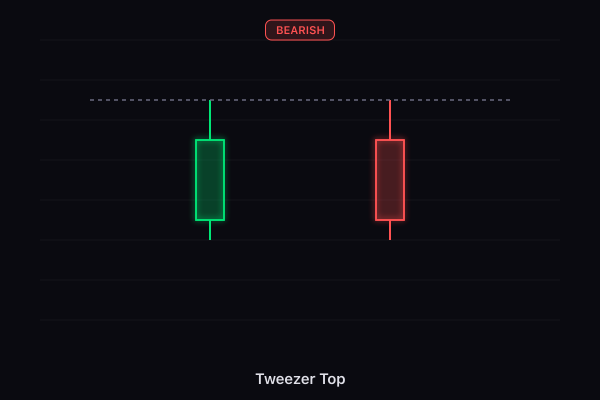
What it looks like
Two consecutive candles with almost identical highs. First is green, second is red.
What it means
Price hit a ceiling twice and got rejected both times. The market is telling you: "this price level is defended by sellers."
Where it appears
Top of an uptrend.
How to trade it
Short below the second candle's low.
Tip
More reliable at a resistance level from Auto Trendlines. Two rejections at the same price = strong resistance.
Tweezer Bottom
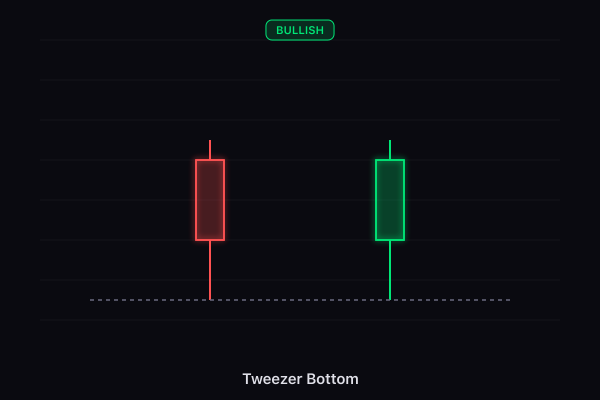
What it looks like
Two consecutive candles with almost identical lows. First is red, second is green.
What it means
Price hit a floor twice and bounced both times. Strong buyer defense.
Where it appears
Bottom of a downtrend.
How to trade it
Buy above the second candle's high.
Tip
Combined with a Liquidity Trap bear trap signal = very strong bounce setup.
Bullish Harami
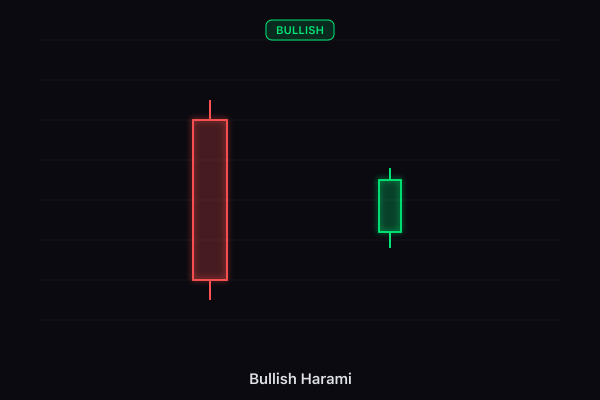
What it looks like
A large red candle followed by a smaller green candle whose body is entirely within the red candle's body.
What it means
After a strong sell-off candle, the next candle shows dramatically reduced selling. The bears are losing steam.
Where it appears
Bottom of a downtrend.
How to trade it
Wait for confirmation — the third candle should close above the harami's green candle.
Tip
Think of it as "the selling is shrinking." The small body inside the big one = momentum dying.
Bearish Harami
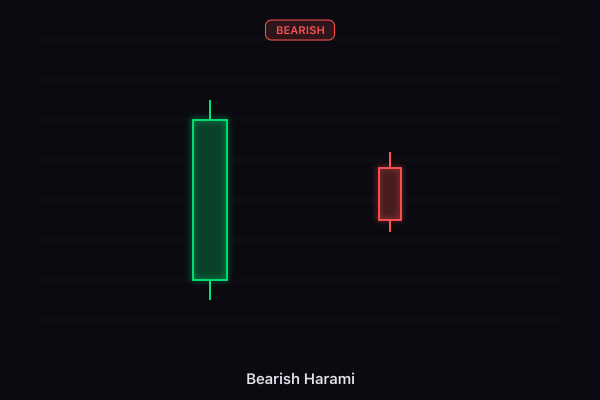
What it looks like
A large green candle followed by a smaller red candle contained within it.
What it means
After a strong rally candle, buying pressure collapsed.
Where it appears
Top of an uptrend.
How to trade it
Wait for confirmation on the third candle.
Tip
If the Exhaustion Detector is showing overbought AND a bearish harami appears, the signal is much stronger.
Bullish Harami Cross
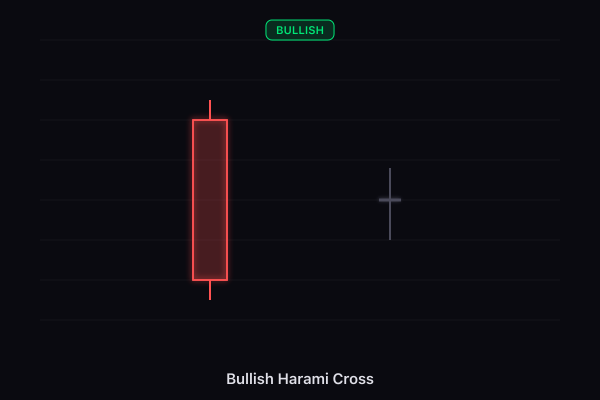
What it looks like
A large red candle followed by a doji contained within it.
What it means
Same as bullish harami but the doji (perfect indecision) makes it stronger. The selling stopped completely.
Where it appears
Bottom of a downtrend.
How to trade it
Stronger than a regular harami. Still wait for confirmation but with higher confidence.
Tip
The doji inside a large candle is one of the clearest "the move just died" signals in all of candlestick analysis.
Bearish Harami Cross
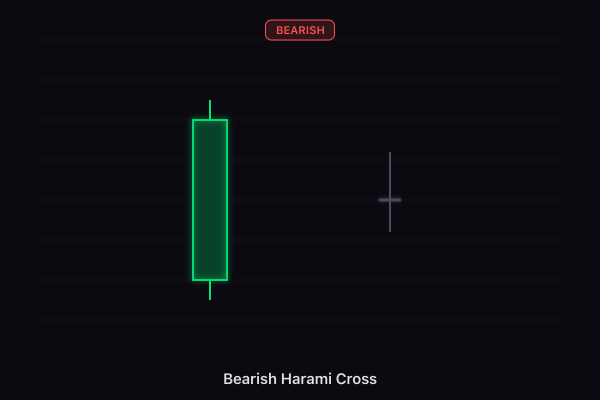
What it looks like
A large green candle followed by a doji contained within it.
What it means
Buying stopped dead. Complete stall after a strong up-move.
Where it appears
Top of an uptrend.
How to trade it
Sell on confirmation below the doji's low.
Tip
At resistance + overbought RSI, this is a strong short setup.
On-Neck
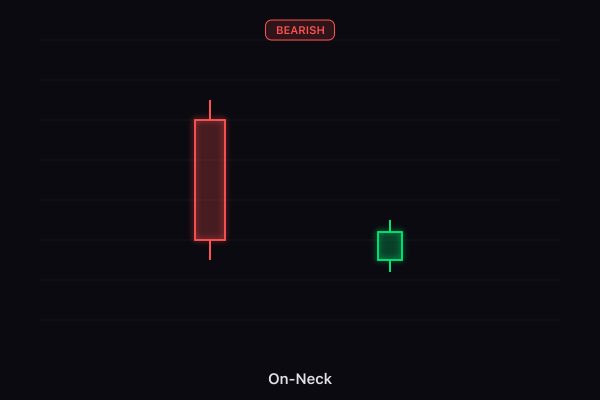
What it looks like
A red candle followed by a small green candle that opens lower but closes at or near the red candle's low.
What it means
Buyers tried to recover but could only reach the previous low. The downtrend is likely to continue.
Where it appears
During a downtrend.
How to trade it
Weak pattern. Confirms continuation of the bearish trend but not strong enough to trade alone.
Tip
If this appears during risk-off (Risk Meter), the continuation is more likely.
In-Neck
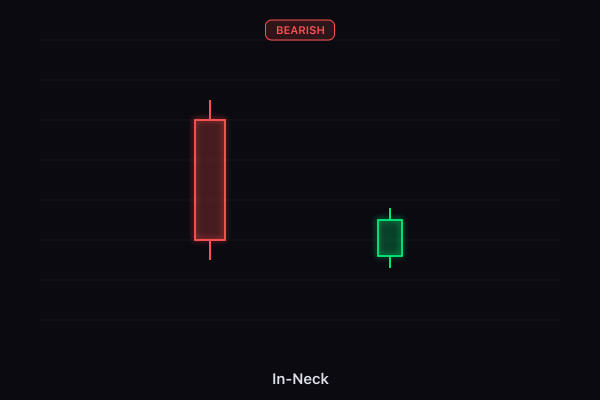
What it looks like
Similar to on-neck but the green candle closes slightly into the red candle's body (not just at the low).
What it means
Slightly better recovery attempt by buyers, but still not enough. Downtrend likely continues.
Where it appears
During a downtrend.
How to trade it
Weak signal. Use only as confirmation of other bearish indicators.
Tip
Compare with piercing line — piercing closes above midpoint (bullish), in-neck closes near the bottom (bearish).
Thrusting
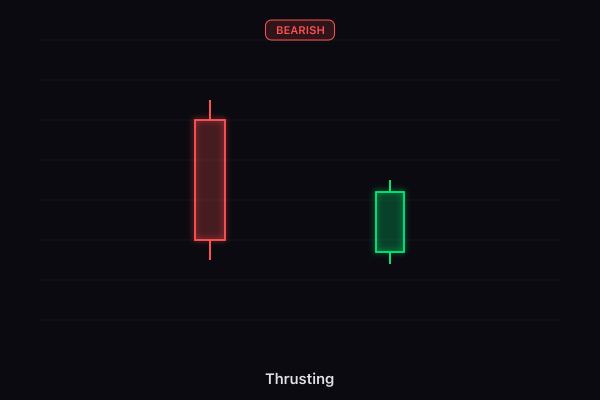
What it looks like
Red candle followed by green candle that closes into the red body but below its midpoint.
What it means
Buyers pushed back but not hard enough. They couldn't reclaim the midpoint, so sellers still have the edge.
Where it appears
During a downtrend.
How to trade it
Weak pattern. The downtrend is more likely to continue than reverse.
Tip
This is the weaker version of a piercing line. Same setup, but the recovery wasn't strong enough.
Bullish Counterattack
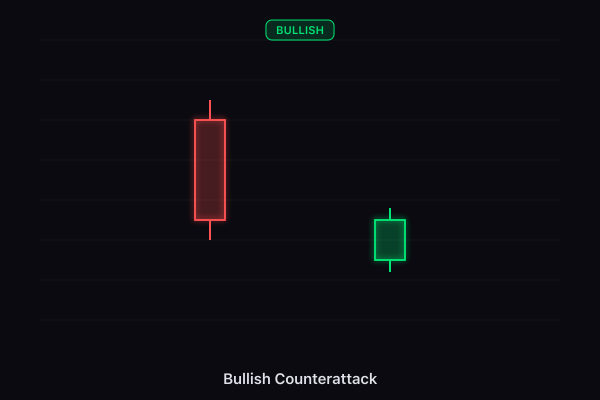
What it looks like
A red candle followed by a green candle that opens much lower but closes at the same level as the red candle's close.
What it means
A massive gap down that buyers completely recovered. Even though they didn't push above the previous close, the recovery shows strength.
Where it appears
Bottom of a downtrend.
How to trade it
Buy on confirmation above the counterattack candle's high.
Tip
The gap down + recovery = strong buyer commitment. More common in stocks than crypto (crypto doesn't gap as much).
Bearish Counterattack
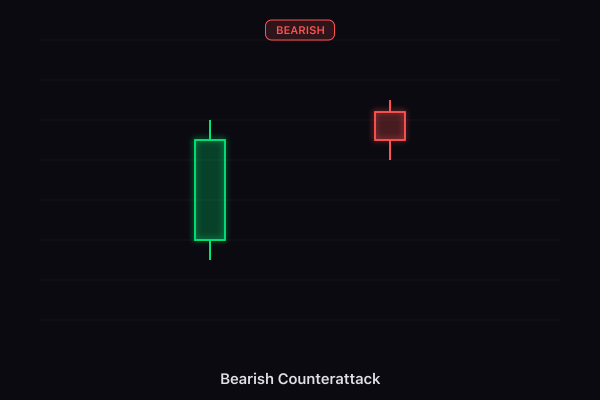
What it looks like
Green candle followed by red candle that opens much higher but closes at the same level as the green candle's close.
What it means
Gap up completely erased by sellers.
Where it appears
Top of an uptrend.
How to trade it
Sell on confirmation below the counterattack candle's low.
Tip
Mirror of bullish counterattack.
Bullish Kicker
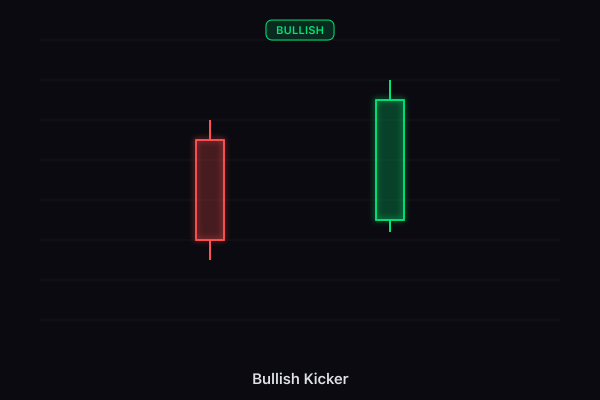
What it looks like
A red candle followed by a green candle that opens at or above the red candle's OPEN (not close — the open). A dramatic gap up.
What it means
Overnight or between-bar sentiment completely reversed. Something fundamental changed. Buyers are now in total control.
Where it appears
Can appear anywhere. Often marks a major trend change.
How to trade it
One of the strongest two-candle signals. Buy immediately.
Tip
Extremely rare but extremely reliable. When you see it, act on it.
Bearish Kicker
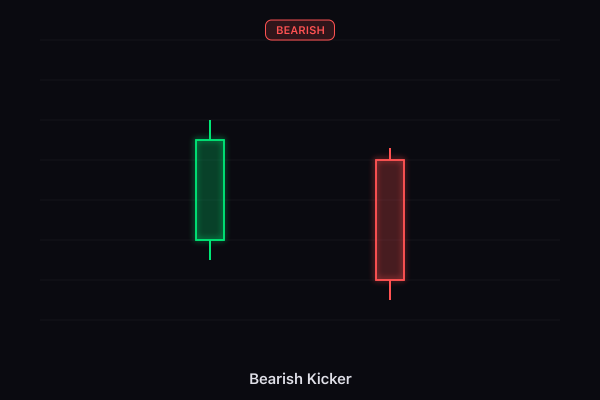
What it looks like
Green candle followed by red candle that opens at or below the green candle's open.
What it means
Complete sentiment reversal. Sellers took over violently.
Where it appears
Can appear anywhere.
How to trade it
Sell immediately. Don't wait for confirmation.
Tip
Often caused by major news events or surprise announcements.
Matching Low
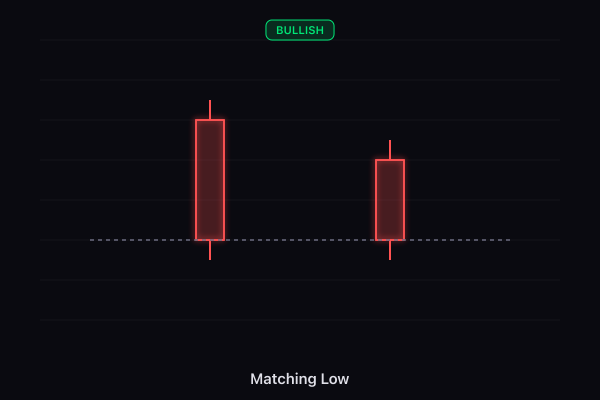
What it looks like
Two red candles with identical (or nearly identical) closing prices.
What it means
Price tried to go lower on the second candle but couldn't close below the first. A floor has been established.
Where it appears
Bottom of a downtrend.
How to trade it
Buy above the second candle's high with stop below the matching lows.
Tip
Similar logic to tweezer bottom but using closes instead of lows.
Homing Pigeon
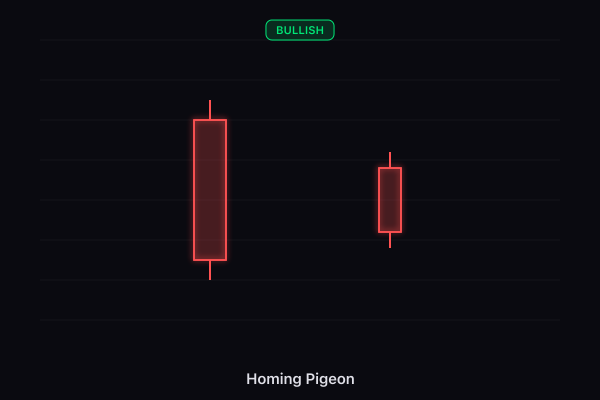
What it looks like
A large red candle followed by a smaller red candle contained within the first (like a bearish harami, but both candles are red).
What it means
Selling pressure is dramatically decreasing. The second red candle is much smaller — sellers are running out of steam.
Where it appears
Bottom of a downtrend.
How to trade it
Wait for a green confirmation candle.
Tip
Think of it as "the selloff is shrinking." Each bar of selling is weaker than the last.
Descending Hawk
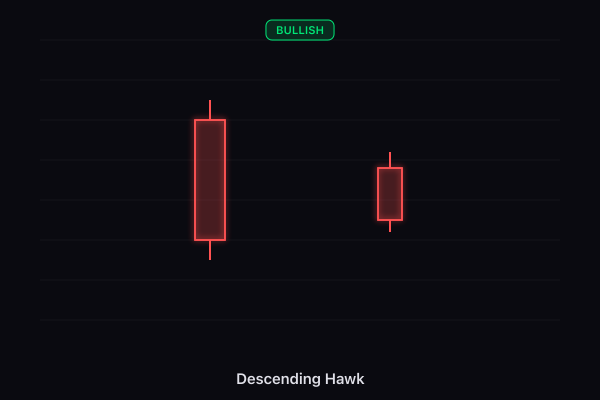
What it looks like
Two red candles where the second has a lower open but closes higher than the first candle's close. Second body is within the first.
What it means
Despite opening lower, buyers pushed the close higher than expected. Bearish momentum is dying.
Where it appears
Bottom of a downtrend.
How to trade it
Similar to homing pigeon — wait for green confirmation.
Tip
The key detail is the second close being higher despite the lower open. Subtle but meaningful.
Part 3: Three+ Candle Patterns
Morning Star
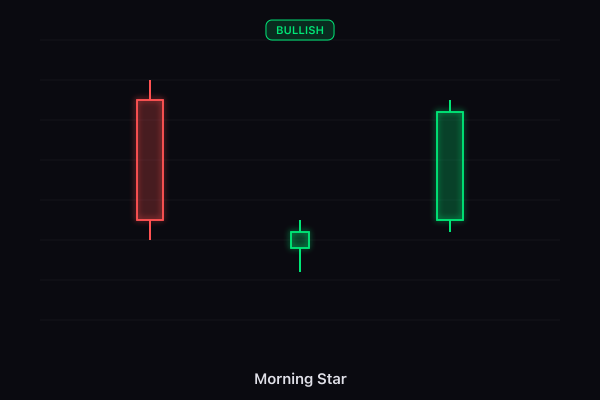
What it looks like
Red candle → small body candle (any color) → green candle. The small middle candle sits below both the red and green.
What it means
Day 1: sellers in control. Day 2: indecision, the selling stalled. Day 3: buyers took over. Classic bottom formation.
Where it appears
Bottom of a downtrend.
How to trade it
Buy on the close of the third (green) candle or on the open of the fourth.
Tip
One of the top 3 most reliable reversal patterns in existence. Combined with an Exhaustion capitulation signal = near-certain bottom.
Evening Star
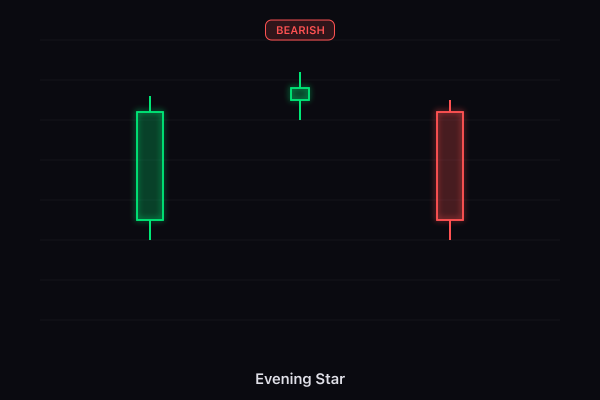
What it looks like
Green candle → small body → red candle. Mirror of morning star.
What it means
Day 1: buyers in control. Day 2: stall. Day 3: sellers take over. Classic top.
Where it appears
Top of an uptrend.
How to trade it
Sell on the close of the third candle.
Tip
At a resistance level with overbought RSI, this is as reliable as it gets for a top signal.
Morning Doji Star
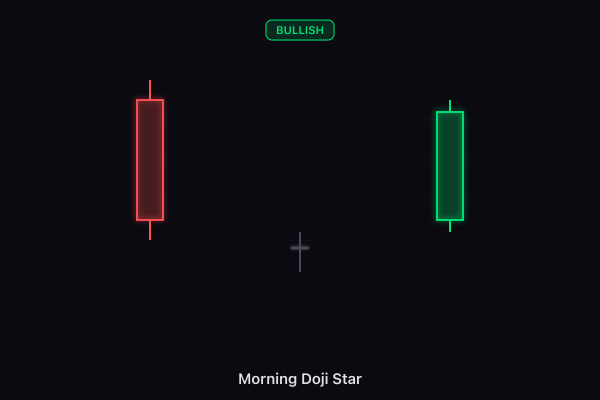
What it looks like
Same as morning star but the middle candle is specifically a doji.
What it means
Even stronger than a regular morning star because the doji shows PERFECT indecision before the reversal.
Where it appears
Bottom of a downtrend.
How to trade it
Buy on the third candle's close. High confidence.
Tip
The doji version is rarer but more reliable than the standard morning star.
Evening Doji Star
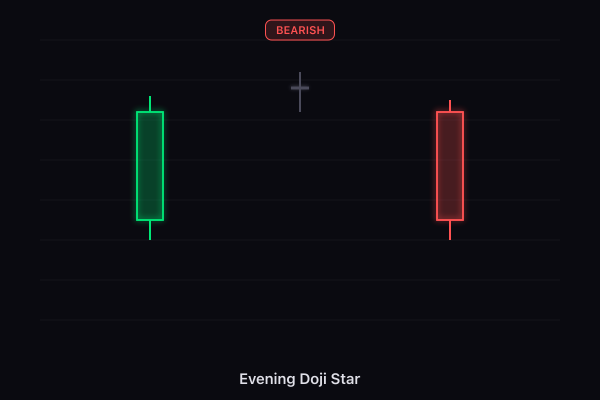
What it looks like
Green candle → doji → red candle.
What it means
Perfect indecision at the top followed by a decisive selloff.
Where it appears
Top of an uptrend.
How to trade it
Sell on the third candle. Very reliable.
Tip
TradeOptics's Bar Analysis Report detects both morning and evening star patterns automatically.
Three White Soldiers
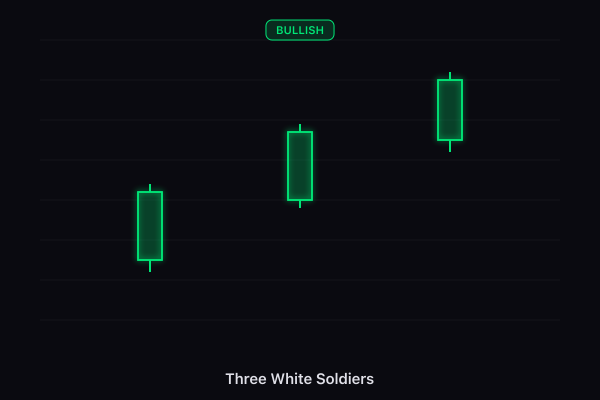
What it looks like
Three consecutive green candles, each closing higher than the last, each opening within the previous candle's body. Small or no upper wicks.
What it means
Sustained buying pressure over three periods. Buyers are in complete control and gaining momentum.
Where it appears
After a downtrend (reversal) or during an uptrend (continuation).
How to trade it
Buy on the close of the third candle. Momentum is with you.
Tip
Watch the wicks. If the third soldier has a long upper wick, the pattern may be weakening (see "Advance Block" below).
Three Black Crows
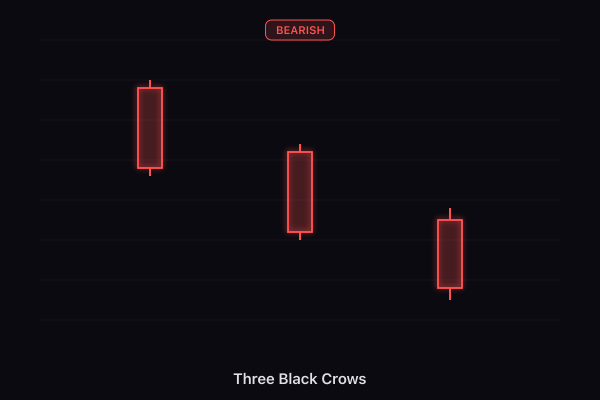
What it looks like
Three consecutive red candles, each closing lower than the last. Small or no lower wicks.
What it means
Sustained selling pressure. Sellers dominate for three straight periods.
Where it appears
After an uptrend (reversal) or during a downtrend (continuation).
How to trade it
Sell on the close of the third crow. The downtrend has strong momentum.
Tip
If Smart Money shows distribution throughout these three candles, expect more downside.
Three Inside Up
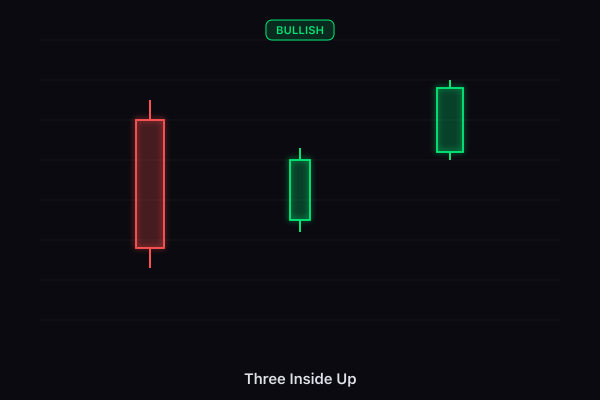
What it looks like
Bullish harami (large red + small green inside it) followed by a third green candle that closes above the first red candle's open.
What it means
The harami showed selling stalled. The third candle confirms buyers have taken over.
Where it appears
Bottom of a downtrend.
How to trade it
Buy on the third candle. This is a "confirmed harami."
Tip
More reliable than a harami alone because you have the confirmation built in.
Three Inside Down
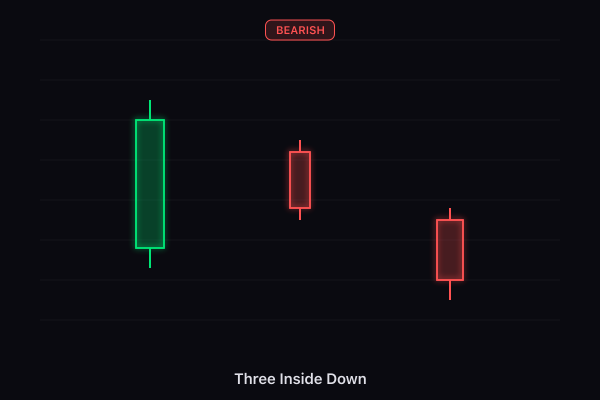
What it looks like
Bearish harami followed by a third red candle closing below the first candle's open.
What it means
Confirmed bearish harami.
Where it appears
Top of an uptrend.
How to trade it
Sell on the third candle.
Tip
The mirror of three inside up.
Three Outside Up
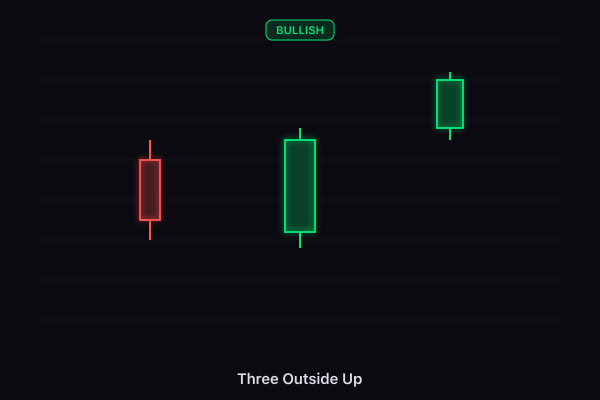
What it looks like
Bullish engulfing followed by a third green candle closing above the engulfing candle's close.
What it means
The engulfing already showed a power shift. The third candle confirms it wasn't a fluke.
Where it appears
Bottom of a downtrend.
How to trade it
Very reliable. Buy on the third candle with confidence.
Tip
This is a "confirmed engulfing" — the strongest two-candle pattern plus confirmation.
Three Outside Down
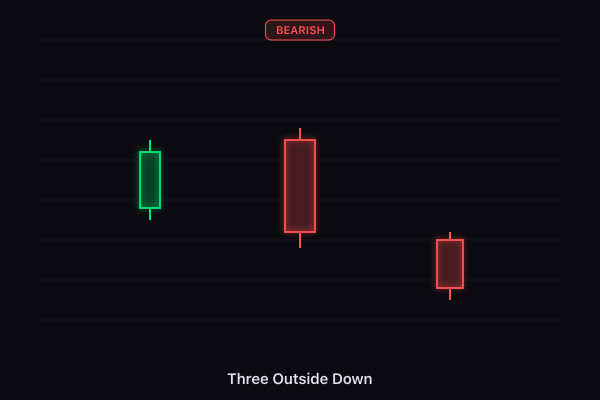
What it looks like
Bearish engulfing followed by a third red candle closing lower.
What it means
Confirmed bearish engulfing.
Where it appears
Top of an uptrend.
How to trade it
Sell with high confidence.
Tip
At resistance + overbought + smart money distributing = maximum conviction short.
Bullish Abandoned Baby
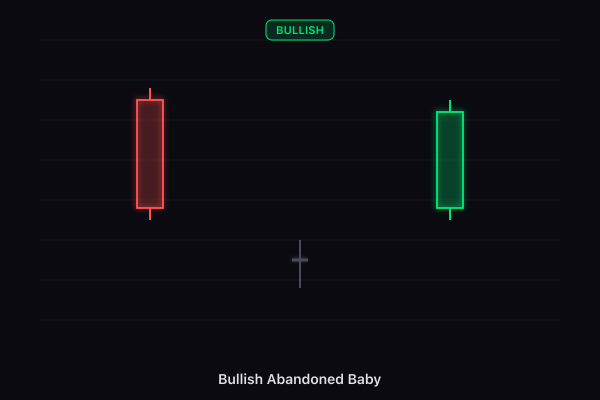
What it looks like
Red candle → doji that gaps below (its high is below the red candle's low) → green candle that gaps above the doji.
What it means
Extremely rare and extremely strong. Complete sentiment reversal with gaps on both sides isolating the doji.
Where it appears
Bottom of a downtrend.
How to trade it
Buy immediately. One of the most reliable patterns in existence.
Tip
Very rare in crypto (24/7 markets don't gap often). More common in stocks. When you see it, act on it.
Bearish Abandoned Baby
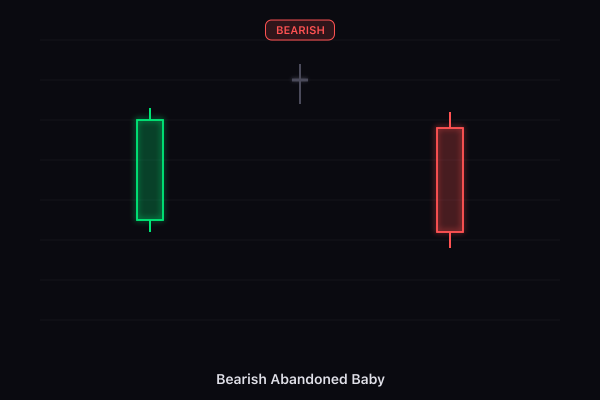
What it looks like
Green candle → doji gapping above → red candle gapping below the doji.
What it means
Mirror of bullish abandoned baby. Extremely rare and strong.
Where it appears
Top of an uptrend.
How to trade it
Sell immediately.
Tip
If you see this pattern, something fundamental changed. Don't fight it.
Bullish Tri-Star
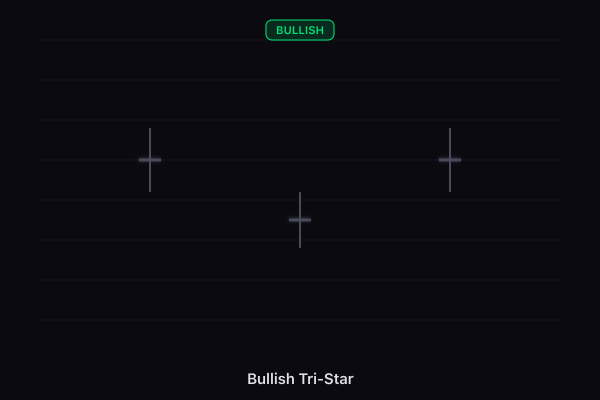
What it looks like
Three consecutive dojis with the middle one gapping lower.
What it means
Three candles of complete indecision after a decline, with the middle one at the lowest point. The market tried to go lower and completely stalled.
Where it appears
Bottom of a downtrend.
How to trade it
Buy on the candle after the third doji.
Tip
Extremely rare. Three dojis in a row is unusual. When it happens, pay attention.
Bearish Tri-Star
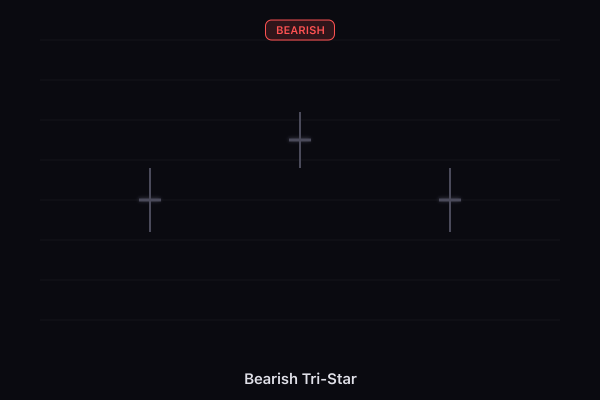
What it looks like
Three dojis with the middle one gapping higher.
What it means
Three candles of stalling at the top.
Where it appears
Top of an uptrend.
How to trade it
Sell on the next candle.
Tip
Mirror of bullish tri-star.
Rising Three Methods
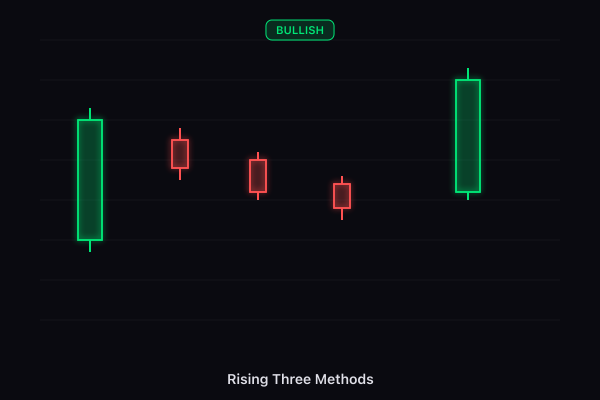
What it looks like
Long green candle → three small red candles (each within the first candle's range) → long green candle closing above the first.
What it means
Trend paused briefly (the three small reds were just a rest) then resumed. The pullback was contained within the original candle — sellers couldn't make progress.
Where it appears
During an uptrend.
How to trade it
Buy on the fifth candle's close. The uptrend is confirmed to continue.
Tip
The key is that the three red candles stay INSIDE the first candle's range. If they break below, the pattern fails.
Falling Three Methods
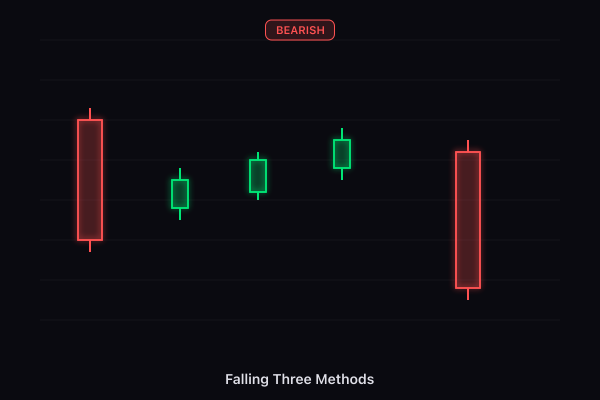
What it looks like
Long red → three small greens (within range) → long red closing below the first.
What it means
Downtrend paused then resumed. The bounce was fake.
Where it appears
During a downtrend.
How to trade it
Sell on the fifth candle.
Tip
Mirror of rising three methods.
Upside Tasuki Gap
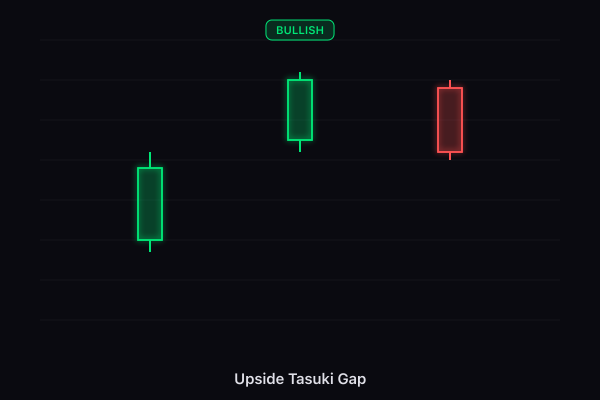
What it looks like
Two green candles with a gap up between them, followed by a red candle that opens within the second green and closes into the gap but doesn't fill it completely.
What it means
The gap shows strong buyer demand. The red candle is just a minor pullback — the gap holds.
Where it appears
During an uptrend.
How to trade it
Buy if the gap holds (red candle doesn't close below the gap).
Tip
If the gap fills completely, the pattern fails and the trend may be weakening.
Downside Tasuki Gap
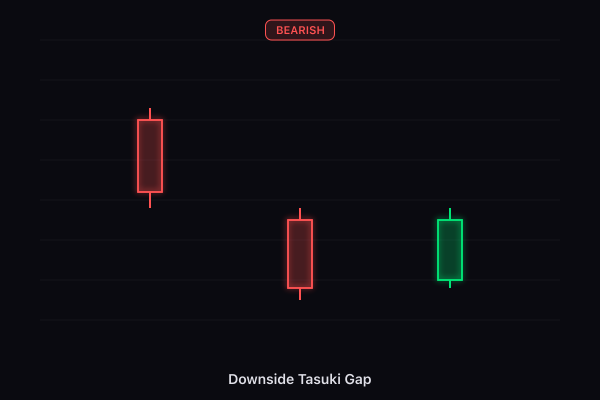
What it looks like
Two red candles with gap down, then a green candle that partially fills the gap but doesn't close it.
What it means
The downtrend gap holds. Minor bounce doesn't change the trend.
Where it appears
During a downtrend.
How to trade it
Sell if the gap remains open.
Tip
Mirror of upside tasuki gap.
Bullish Three-Line Strike
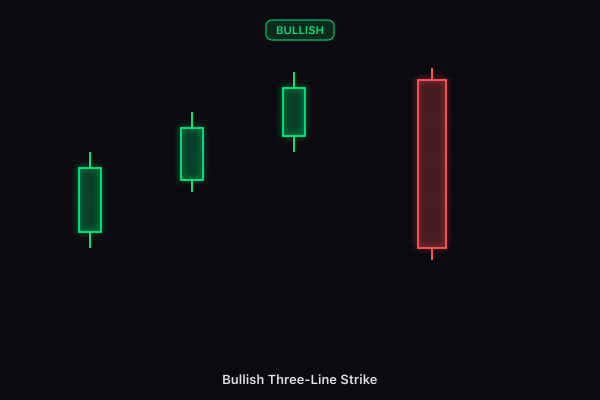
What it looks like
Three green candles (like three white soldiers) followed by a large red candle that engulfs all three — BUT then price continues up after.
What it means
Counter-intuitive. The big red candle looks scary but it's actually a shakeout. The uptrend resumes. Think of it as a stop hunt within a trend.
Where it appears
During an uptrend.
How to trade it
Buy after the red candle if the next candle is green. The red candle was a trap.
Tip
This pattern has one of the highest statistical win rates (~83% bullish continuation according to Bulkowski's research). The red candle scares retail out, then the trend resumes.
Bearish Three-Line Strike
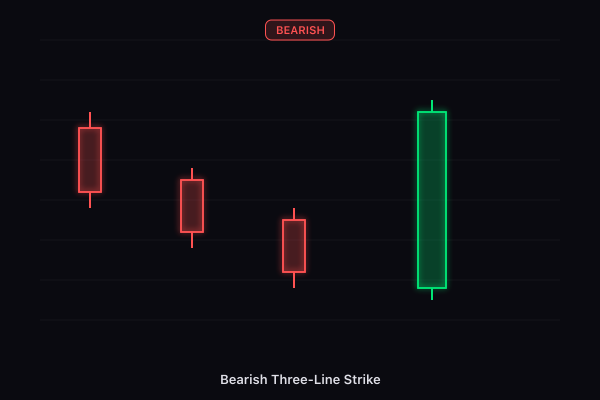
What it looks like
Three red candles followed by a large green candle that engulfs all three — then price continues down.
What it means
The green candle was a bull trap. Downtrend resumes.
Where it appears
During a downtrend.
How to trade it
Sell after the green candle if the next candle is red.
Tip
The green candle is a classic trap. If Liquidity Trap Detector flags it as a bull trap, double confirmation.
Deliberation
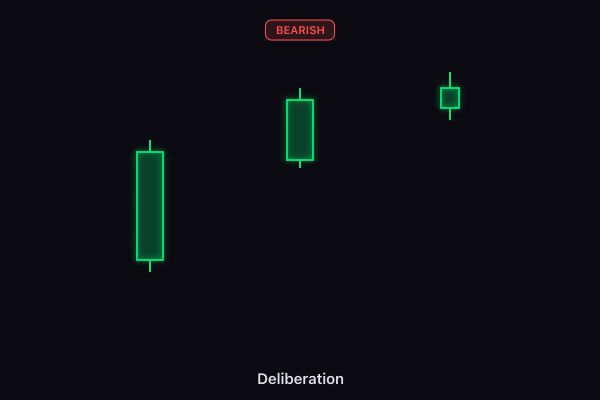
What it looks like
Two strong green candles followed by a small green candle (spinning top or short body) that may gap up.
What it means
Momentum is fading. The first two candles were strong, but the third shows buyers are hesitating. A potential top.
Where it appears
Top of an uptrend.
How to trade it
Weak signal on its own. Wait for a red confirmation candle.
Tip
Combined with Exhaustion Detector showing bull exhaustion, this becomes more meaningful.
Advance Block
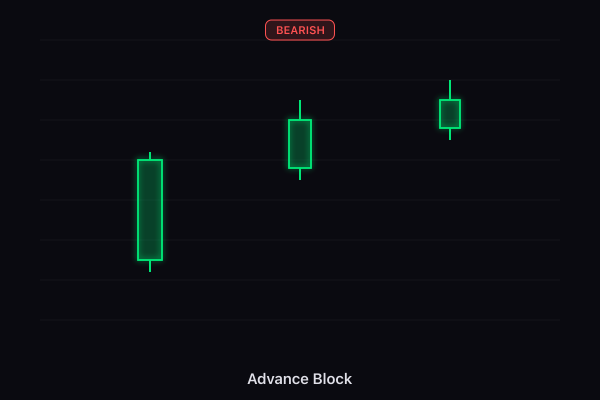
What it looks like
Three green candles but each one has a smaller body and longer upper wick than the previous.
What it means
Buyers are still pushing up but losing strength each candle. The upper wicks show increasing resistance from sellers.
Where it appears
During an uptrend, signaling it's dying.
How to trade it
Reduce long positions or tighten stops. A reversal is building.
Tip
This is what "failing three white soldiers" looks like. Momentum Health will show the bars getting dimmer as this forms.
Identical Three Crows
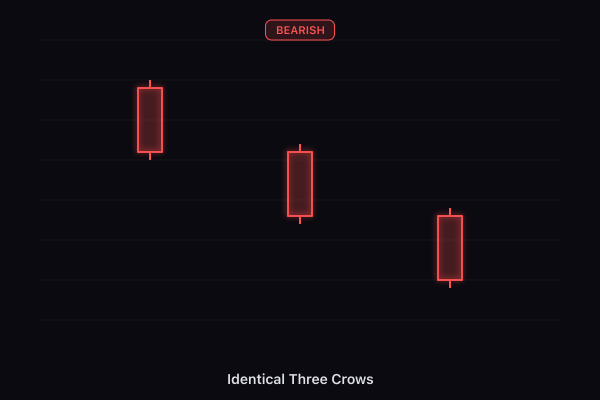
What it looks like
Three red candles where each opens at or very near the previous candle's close. Very orderly decline.
What it means
Methodical, persistent selling. No bounces, no gaps — just steady pressure down.
Where it appears
During or starting a downtrend.
How to trade it
Sell. The orderly nature suggests institutional selling, not panic.
Tip
If Smart Money shows distribution throughout, this is likely whale-driven selling.
Upside Gap Two Crows
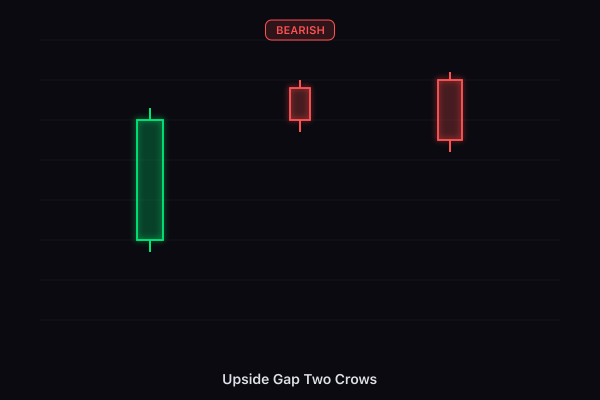
What it looks like
Green candle → small red candle that gaps up → larger red candle that engulfs the first red but still closes above the green candle's close.
What it means
Two failed attempts to continue higher. The gap up couldn't hold. Sellers are taking control.
Where it appears
Top of an uptrend.
How to trade it
Sell on confirmation below the green candle's close.
Tip
The gap up followed by two red candles is a strong rejection signal.
Mat Hold
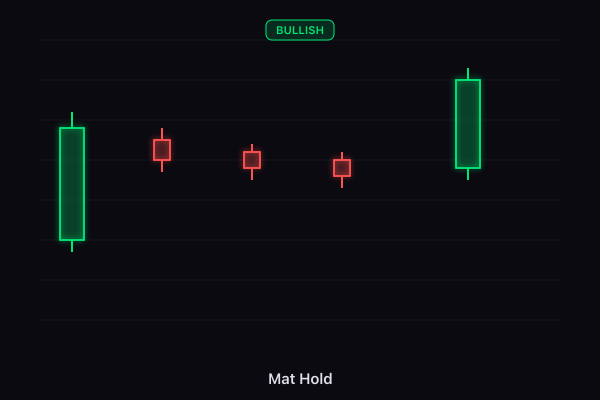
What it looks like
Long green candle → small red candle gapping up → two more small declining candles (staying above the first green's midpoint) → green candle closing above the first.
What it means
Similar to rising three methods but with a gap. The pullback is contained and the trend resumes.
Where it appears
During a strong uptrend.
How to trade it
Buy on the fifth candle.
Tip
Rare but reliable. The gap + contained pullback shows the trend has strong underlying support.
Ladder Bottom
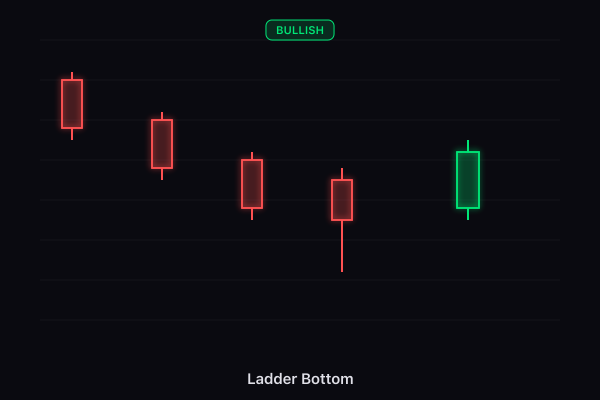
What it looks like
Three red candles making lower lows → fourth red candle with a long upper wick → fifth candle is green and opens above the fourth.
What it means
Steady decline, then buyers start showing up (the upper wick on the fourth), then they take over (the green fifth candle).
Where it appears
Bottom of a downtrend.
How to trade it
Buy on the fifth candle's close.
Tip
The upper wick on the fourth candle is the key — it's the first sign of buyer presence after three candles of selling.
Quick Reference Table
| Pattern | Candles | Signal | Confidence | Location |
|---|---|---|---|---|
| Doji | 1 | Neutral | ★★★★★ | After any trend |
| Long-legged Doji | 1 | Neutral | ★★★★★ | Turning points |
| Dragonfly Doji | 1 | Bullish | ★★★★★ | Downtrend bottom |
| Gravestone Doji | 1 | Bearish | ★★★★★ | Uptrend top |
| Hammer | 1 | Bullish | ★★★★★ | Downtrend bottom |
| Inverted Hammer | 1 | Bullish | ★★★★★ | Downtrend bottom |
| Hanging Man | 1 | Bearish | ★★★★★ | Uptrend top |
| Shooting Star | 1 | Bearish | ★★★★★ | Uptrend top |
| Bullish Marubozu | 1 | Strong bullish | ★★★★★ | Anywhere |
| Bearish Marubozu | 1 | Strong bearish | ★★★★★ | Anywhere |
| Spinning Top | 1 | Neutral | ★★★★★ | Anywhere |
| High Wave | 1 | Neutral | ★★★★★ | Turning points |
| Bullish Belt Hold | 1 | Bullish | ★★★★★ | After decline |
| Bearish Belt Hold | 1 | Bearish | ★★★★★ | After rally |
| Long Lower Shadow | 1 | Bullish | ★★★★★ | At support |
| Long Upper Shadow | 1 | Bearish | ★★★★★ | At resistance |
| Bullish Engulfing | 2 | Strong bullish | ★★★★★ | Downtrend bottom |
| Bearish Engulfing | 2 | Strong bearish | ★★★★★ | Uptrend top |
| Piercing Line | 2 | Bullish | ★★★★★ | Downtrend bottom |
| Dark Cloud Cover | 2 | Bearish | ★★★★★ | Uptrend top |
| Tweezer Top | 2 | Bearish | ★★★★★ | Uptrend top |
| Tweezer Bottom | 2 | Bullish | ★★★★★ | Downtrend bottom |
| Bullish Harami | 2 | Bullish | ★★★★★ | Downtrend bottom |
| Bearish Harami | 2 | Bearish | ★★★★★ | Uptrend top |
| Bullish Harami Cross | 2 | Bullish | ★★★★★ | Downtrend bottom |
| Bearish Harami Cross | 2 | Bearish | ★★★★★ | Uptrend top |
| On-Neck | 2 | Bearish cont. | ★★★★★ | During downtrend |
| In-Neck | 2 | Bearish cont. | ★★★★★ | During downtrend |
| Thrusting | 2 | Bearish cont. | ★★★★★ | During downtrend |
| Bullish Counterattack | 2 | Bullish | ★★★★★ | Downtrend bottom |
| Bearish Counterattack | 2 | Bearish | ★★★★★ | Uptrend top |
| Bullish Kicker | 2 | Very strong bullish | ★★★★★ | Anywhere |
| Bearish Kicker | 2 | Very strong bearish | ★★★★★ | Anywhere |
| Matching Low | 2 | Bullish | ★★★★★ | Downtrend bottom |
| Homing Pigeon | 2 | Bullish | ★★★★★ | Downtrend bottom |
| Descending Hawk | 2 | Bullish | ★★★★★ | Downtrend bottom |
| Morning Star | 3 | Strong bullish | ★★★★★ | Downtrend bottom |
| Evening Star | 3 | Strong bearish | ★★★★★ | Uptrend top |
| Morning Doji Star | 3 | Very strong bullish | ★★★★★ | Downtrend bottom |
| Evening Doji Star | 3 | Very strong bearish | ★★★★★ | Uptrend top |
| Three White Soldiers | 3 | Strong bullish | ★★★★★ | After downtrend |
| Three Black Crows | 3 | Strong bearish | ★★★★★ | After uptrend |
| Three Inside Up | 3 | Bullish | ★★★★★ | Downtrend bottom |
| Three Inside Down | 3 | Bearish | ★★★★★ | Uptrend top |
| Three Outside Up | 3 | Strong bullish | ★★★★★ | Downtrend bottom |
| Three Outside Down | 3 | Strong bearish | ★★★★★ | Uptrend top |
| Bullish Abandoned Baby | 3 | Very strong bullish | ★★★★★ | Downtrend bottom |
| Bearish Abandoned Baby | 3 | Very strong bearish | ★★★★★ | Uptrend top |
| Bullish Tri-Star | 3 | Strong bullish | ★★★★★ | Downtrend bottom |
| Bearish Tri-Star | 3 | Strong bearish | ★★★★★ | Uptrend top |
| Rising Three Methods | 5 | Bullish cont. | ★★★★★ | During uptrend |
| Falling Three Methods | 5 | Bearish cont. | ★★★★★ | During downtrend |
| Upside Tasuki Gap | 3 | Bullish cont. | ★★★★★ | During uptrend |
| Downside Tasuki Gap | 3 | Bearish cont. | ★★★★★ | During downtrend |
| Bullish Three-Line Strike | 4 | Bullish cont. | ★★★★★ | During uptrend |
| Bearish Three-Line Strike | 4 | Bearish cont. | ★★★★★ | During downtrend |
| Deliberation | 3 | Bearish warning | ★★★★★ | Uptrend top |
| Advance Block | 3 | Bearish warning | ★★★★★ | During uptrend |
| Identical Three Crows | 3 | Strong bearish | ★★★★★ | After uptrend |
| Upside Gap Two Crows | 3 | Bearish | ★★★★★ | Uptrend top |
| Mat Hold | 5 | Bullish cont. | ★★★★★ | During uptrend |
| Ladder Bottom | 5 | Bullish | ★★★★★ | Downtrend bottom |
Part of the TradeOptics Full Deck education bundle. Learn more at tradeoptics.io