← Back to TradeOptics

Quick Reference Cheat Sheet
Print this or keep it on a second monitor. One-page guide to all 8 indicators.
01
Signal Color Guide
Momentum Health Check (bar colors)
| Color | Meaning | Action |
|---|---|---|
| Bright Green | Buyers winning + volume confirms | Strong bullish — trade with it |
| Dim Green | Buyers winning, low volume | Cautious bullish — might be weak |
| Bright Red | Sellers winning + volume confirms | Strong bearish — trade with it |
| Dim Red | Sellers winning, low volume | Cautious bearish — might be weak |
| Gray | No clear direction | No trade — wait |
Volatility Regime (background color)
| Color | Regime | Stop Distance | Strategy |
|---|---|---|---|
| Green | Calm | Tight (1.5x ATR) | Range trading, mean reversion |
| Yellow | Elevated | Medium (2x ATR) | Follow momentum, wider stops |
| Red | Extreme | Wide (3x ATR) | Reduce size or stay out |
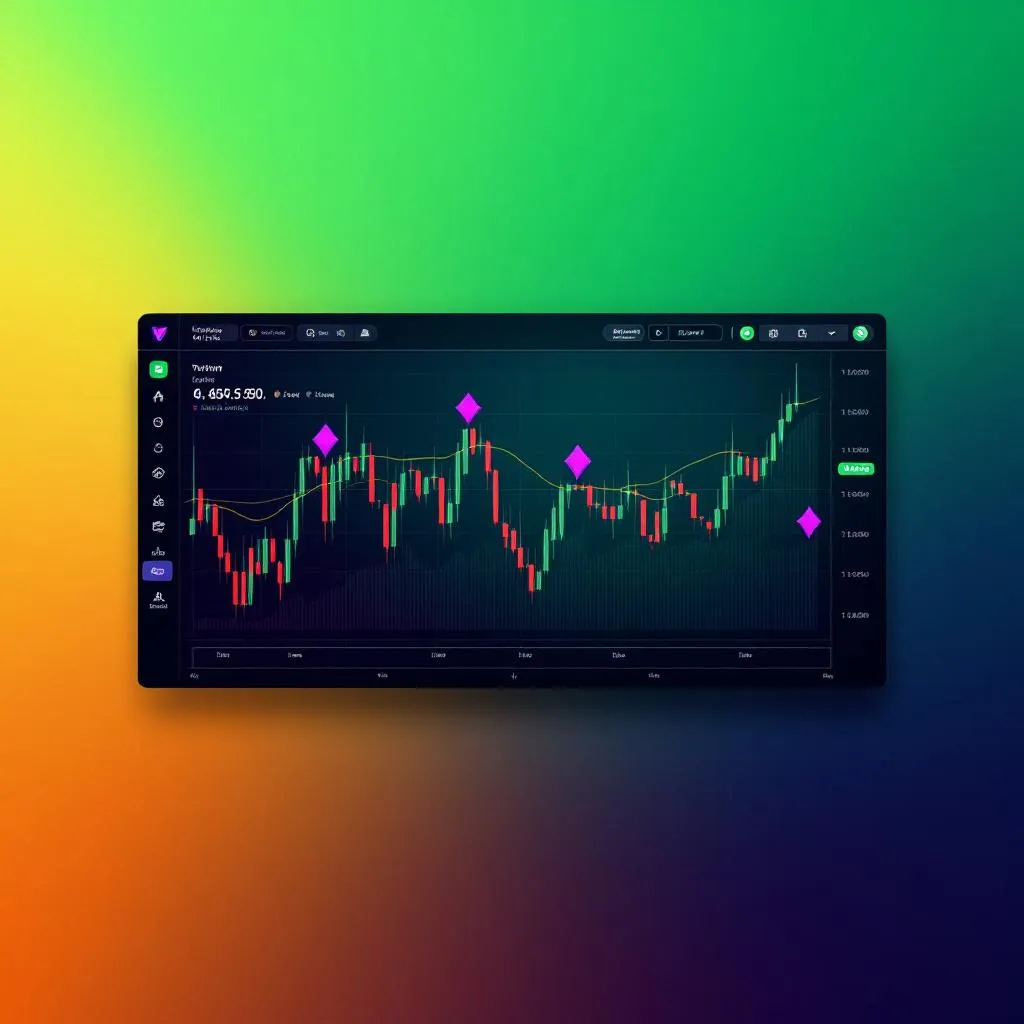
| Purple diamonds | Squeeze building | — | Big move coming, direction unknown |
Smart Money Tracker (histogram)
| Signal | Shape | Meaning |
|---|---|---|
| Green bars | Histogram up | Accumulation — whales buying |
| Red bars | Histogram down | Distribution — whales selling |
| Yellow diamond | Top marker | Volume spike — unusual size |
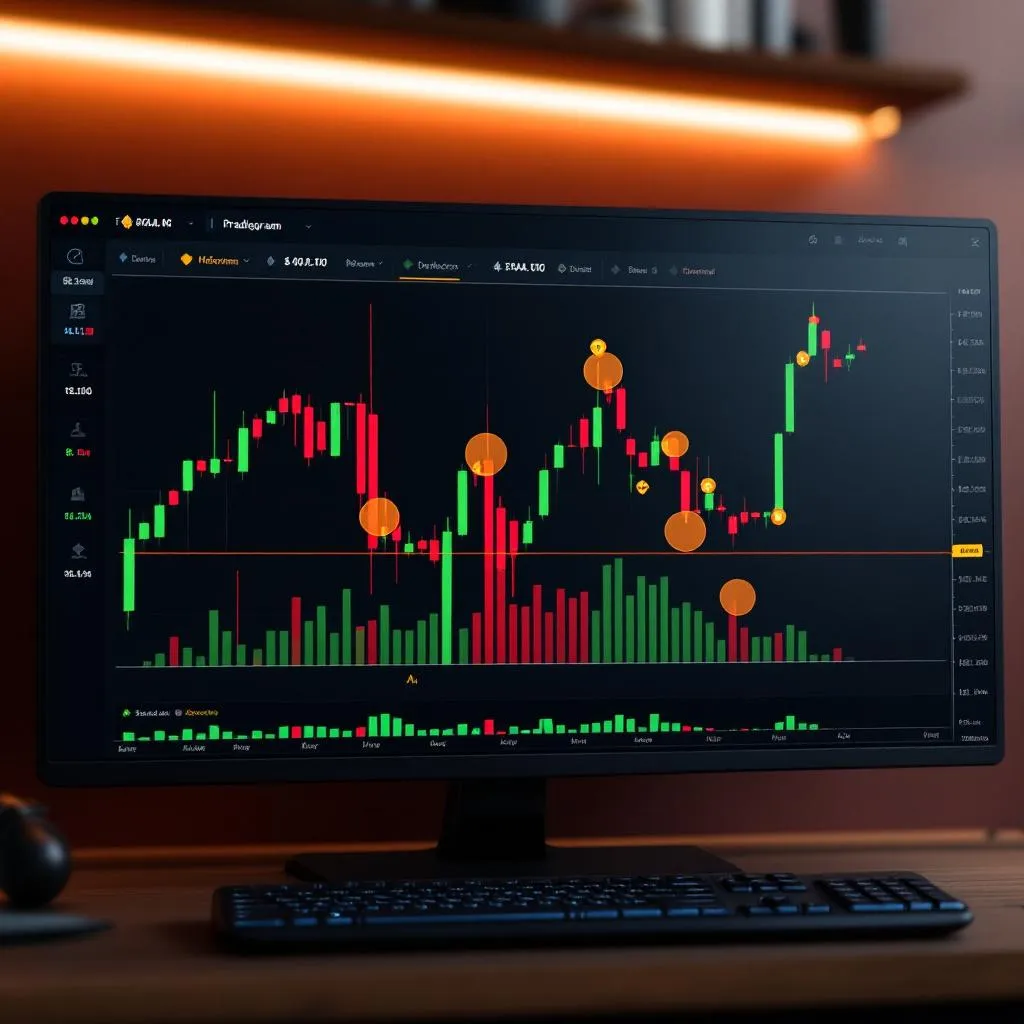
| Orange square | Top marker | Absorption — whale hiding activity |
| Orange circle | Bottom marker | Stop hunt detected |
| Green triangle up | Bottom marker | Bullish divergence — smart $ buying dip |
| Red triangle down | Top marker | Bearish divergence — smart $ selling rally |
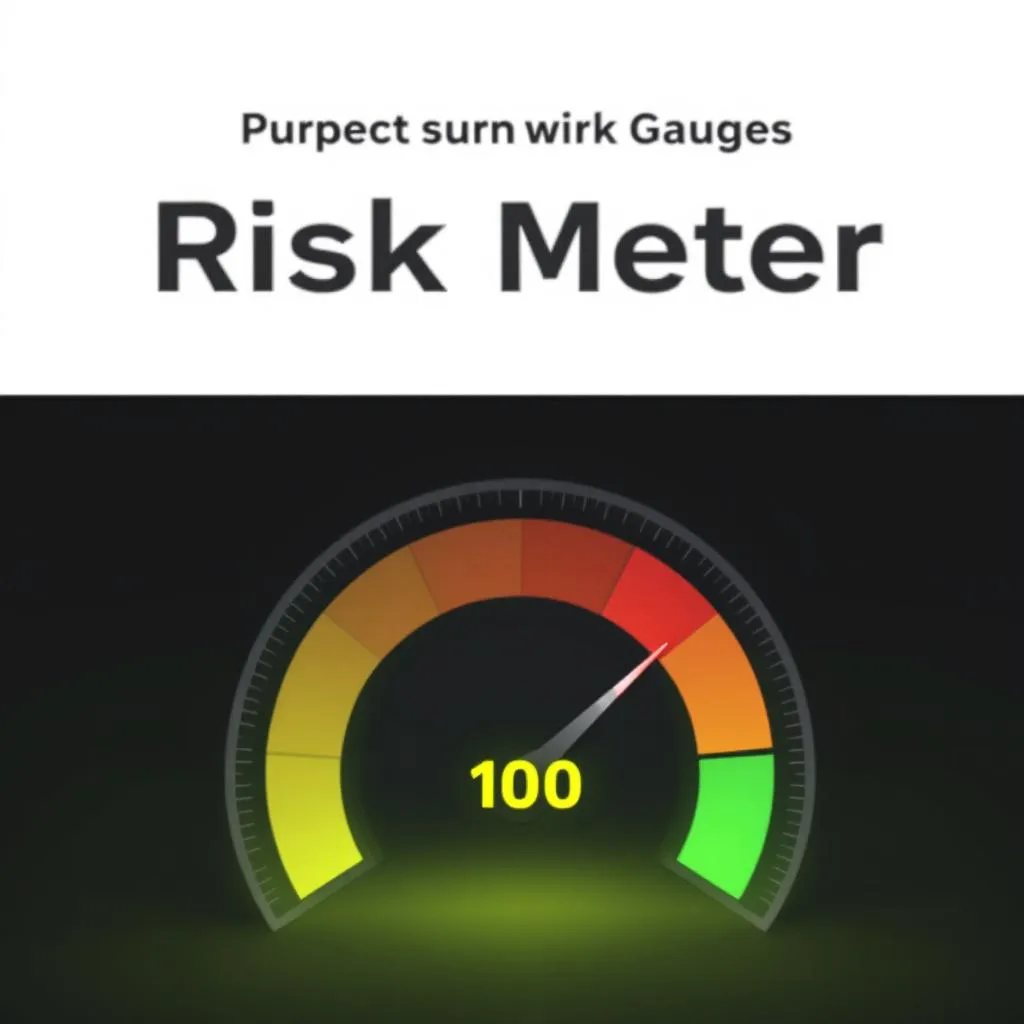
Risk-On / Risk-Off Meter
| Score Range | Regime | Action |
|---|---|---|
| +40 to +100 | Strong Risk-On | Aggressive longs OK, full size |
| +15 to +40 | Risk-On | Longs favored, normal size |
| -15 to +15 | Neutral | No edge, small size or wait |
| -40 to -15 | Risk-Off | Defensive, shorts or cash |
| -100 to -40 | Strong Risk-Off | Max fear, cash or hedge |
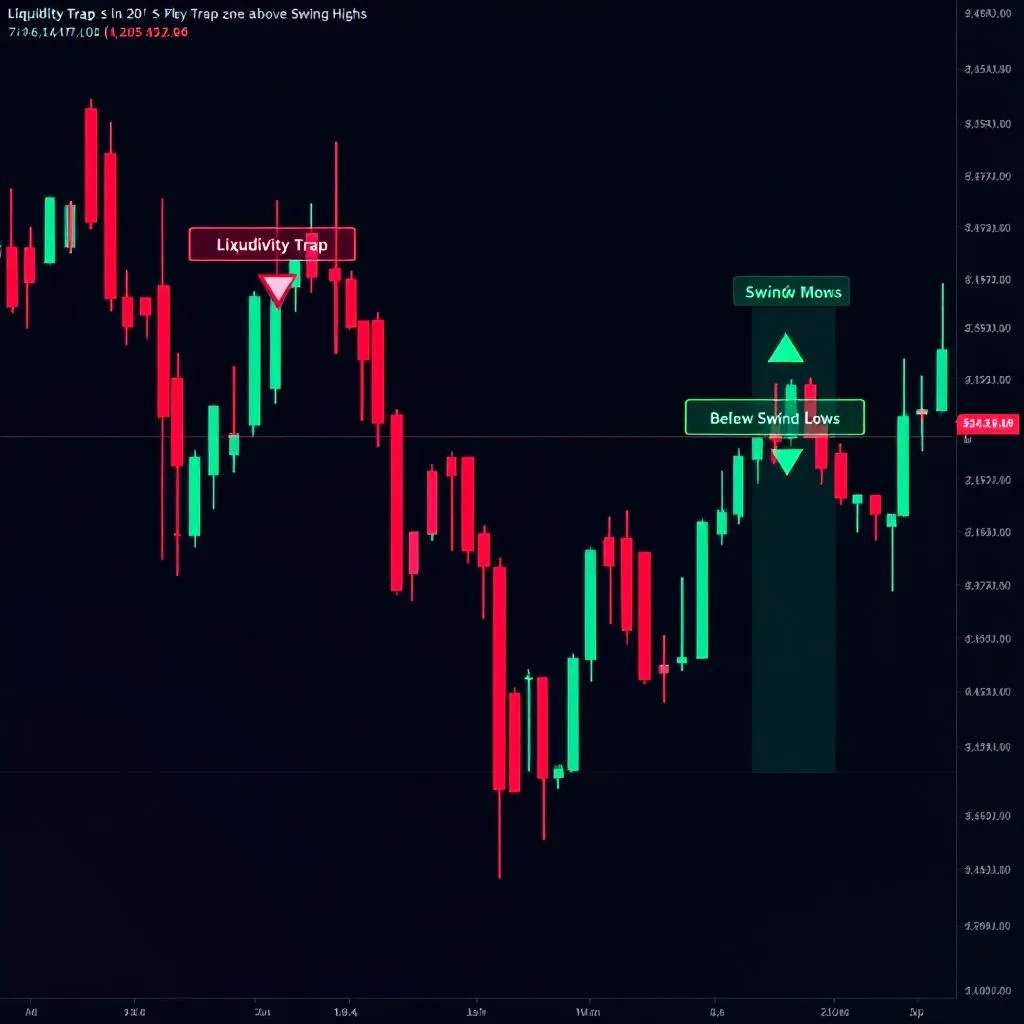
Liquidity Trap Detector
| Signal | Shape | Meaning |
|---|---|---|
| Red boxes | Above swing highs | Trap zone — shorts' stops clustered here |
| Green boxes | Below swing lows | Trap zone — longs' stops clustered here |
| Green triangle up | Below bar | Bear trap — bounce opportunity |
| Red triangle down | Above bar | Bull trap — rejection likely |
Exhaustion Detector (histogram)
| Signal | Shape | Meaning |
|---|---|---|
| Gauge > +50 | Red histogram | Overbought — sellers building |
| Gauge < -50 | Green histogram | Oversold — buyers building |
| Yellow dot (top) | Circle | Bullish exhaustion — pullback coming |
| Yellow dot (bottom) | Circle | Bearish exhaustion — bounce building |
| Green diamond | Bottom marker | SELLING CAPITULATION — best bounce entry |
| Red diamond | Top marker | BUYING CAPITULATION — top likely |
02
Decision Tree — The 8-Step Scan
Run this checklist before every trade:
STEP 1: Risk Meter
  → Risk-Off? —→ Reduce size or skip. Don't fight the market mood.
  → Risk-On?  —→ Continue.

STEP 2: Volatility Regime
  → Extreme (red)? —→ Widen stops 3x or sit out.
  → Calm (green)?   —→ Tight stops, range strategies work.
  → Squeeze?        —→ Big move coming. Wait for direction, then go.

STEP 3: Momentum Health (bar color)
  → Bright green? —→ Buyers confirmed. Look for longs.
  → Bright red?   —→ Sellers confirmed. Look for shorts.
  → Gray?         —→ No edge. Wait.

STEP 4: Smart Money
  → Accumulating (green)? —→ Whales agree with your direction. Good.
  → Distributing (red)?   —→ Whales disagree. Be careful.
  → Divergence?           —→ High-value signal. Trust smart money over price.

STEP 5: Trendlines
  → Near support?    —→ Potential bounce (if buying).
  → Near resistance? —→ Potential rejection (if selling).
  → Break detected?  —→ Trend may be changing.

STEP 6: Liquidity Traps
  → Bear trap (green triangle)? —→ Fake breakdown. Bounce likely.
  → Bull trap (red triangle)?   —→ Fake breakout. Drop likely.
  → In a trap zone?             —→ Don't enter here. Wait for resolution.

STEP 7: Exhaustion
  → Capitulation diamond? —→ Highest probability reversal entry.
  → Exhaustion dot?       —→ Move is tiring. Get ready.
  → Gauge extreme?        —→ Stretched. Reversal building.

STEP 8: Bar Analysis Report
  → Read the panel. Does it confirm your thesis?
  → Check: direction, momentum, volume, patterns, overall bias.
Conviction Scoring
| Signals Agreeing | Conviction | Position Size |
|---|---|---|
| 6–8 indicators | High | Full size |
| 4–5 indicators | Moderate | Half size |
| 2–3 indicators | Low | Quarter size or skip |
| 0–1 indicators | None | No trade |
03
Quick Settings Reference
Crypto (BTC, XRP, altcoins)
| Indicator | Setting | 1h | 4h | Daily |
|---|---|---|---|---|
| Momentum Health | Fast MA | 9 | 9 | 12 |
| Momentum Health | Slow MA | 21 | 21 | 26 |
| Momentum Health | RSI Length | 14 | 14 | 14 |
| Auto Trendlines | Pivot Strength | 3 | 5 | 5 |
| Auto Trendlines | Lookback Bars | 60 | 100 | 150 |
| Smart Money | A/D Lookback | 10 | 14 | 20 |
| Smart Money | Vol Spike Threshold | 2.0 | 2.0 | 2.0 |
| Volatility Regime | ATR Length | 14 | 14 | 14 |
| Volatility Regime | Calm Threshold | 0.7 | 0.7 | 0.7 |
| Volatility Regime | Extreme Threshold | 1.8 | 1.8 | 1.5 |
| Liquidity Trap | Pivot Length | 3 | 5 | 5 |
| Liquidity Trap | Trap Zone Width | 0.4% | 0.3% | 0.3% |
| Risk Meter | Analysis Lookback | 15 | 20 | 20 |
| Exhaustion | RSI Length | 14 | 14 | 14 |
| Exhaustion | MFI Length | 14 | 14 | 14 |
Stocks (TSLA, PLTR, TDOC)
Same as crypto except:
- Momentum Health: Fast MA = 12, Slow MA = 26 on all timeframes (stocks trend smoother)
- Auto Trendlines: Pivot Strength = 5 on all timeframes
- Volatility Regime: Extreme Threshold = 1.5 (stocks are less volatile than crypto)
04
Alert Priority — Set These First
| Priority | Alert | Indicator | Why |
|---|---|---|---|
| 1 | Selling Capitulation | Exhaustion | Your #1 bounce entry signal |
| 2 | Bear Trap Detected | Liquidity Trap | Catches manipulated bottoms |
| 3 | Extreme Volatility | Volatility Regime | Warns you before chaos hits |
| 4 | Risk-Off Shift | Risk Meter | Market mood just flipped — protect capital |
| 5 | Stop Hunt Detected | Smart Money | Someone just manipulated price |
| 6 | Support Break | Auto Trendlines | Key level broken |
| 7 | Bullish Crossover | Momentum Health | Trend just flipped bullish |
| 8 | Squeeze Breakout | Volatility Regime | Big move starting now |
| 9 | Strong Accumulation | Smart Money | Whales loading up |
| 10 | RSI Oversold | Momentum Health | Bounce zone |
Pro tip: On TradingView Premium, set alerts on all your main pairs (XRP, FLR, PAXG, CRO, NEXO) for priorities 1–5. That's 25 alerts covering your most important signals across all pairs. You'll get phone notifications when it matters.
Questions? Email support@tradeoptics.io