Getting Started with TradeOptics
This guide walks you through everything — from adding your first indicator to reading your first signal. Included with all tiers.
Finding your indicators on TradingView
After we grant you access (within 24 hours of submitting your TradingView username), the indicators will appear in your TradingView account. Here's how to find them:
- Open TradingView and go to any chart
- Click the "Indicators" button at the top of the chart (looks like a waveform icon, or press / on your keyboard)
- In the search box, type "TradeOptics" or the indicator name (e.g., "Momentum Health")
- Click on the indicator to add it to your chart
- Repeat for each indicator you want to use
Recommended chart setup
You don't need to add all 8 at once. Start with this beginner setup:
- Main chart: Add Momentum Health Check — this colors your bars and is the easiest to read
- Main chart: Add Auto Trendlines Pro — draws support/resistance for you
- Lower pane: Add Smart Money Tracker — shows what whales are doing
Once you're comfortable with these three, add the rest one at a time.
What each indicator looks like
Here's a visual guide to every indicator and what the colors/signals mean.
Momentum Health Check
Colors every bar on your chart:
- Bright green — Strong buyers + volume confirms. Best bullish signal.
- Dim green — Buyers winning but volume is low. Cautious bullish.
- Bright red — Strong sellers + volume confirms. Best bearish signal.
- Dim red — Sellers winning but volume low. Cautious bearish.
- Gray — No clear direction. Don't trade.
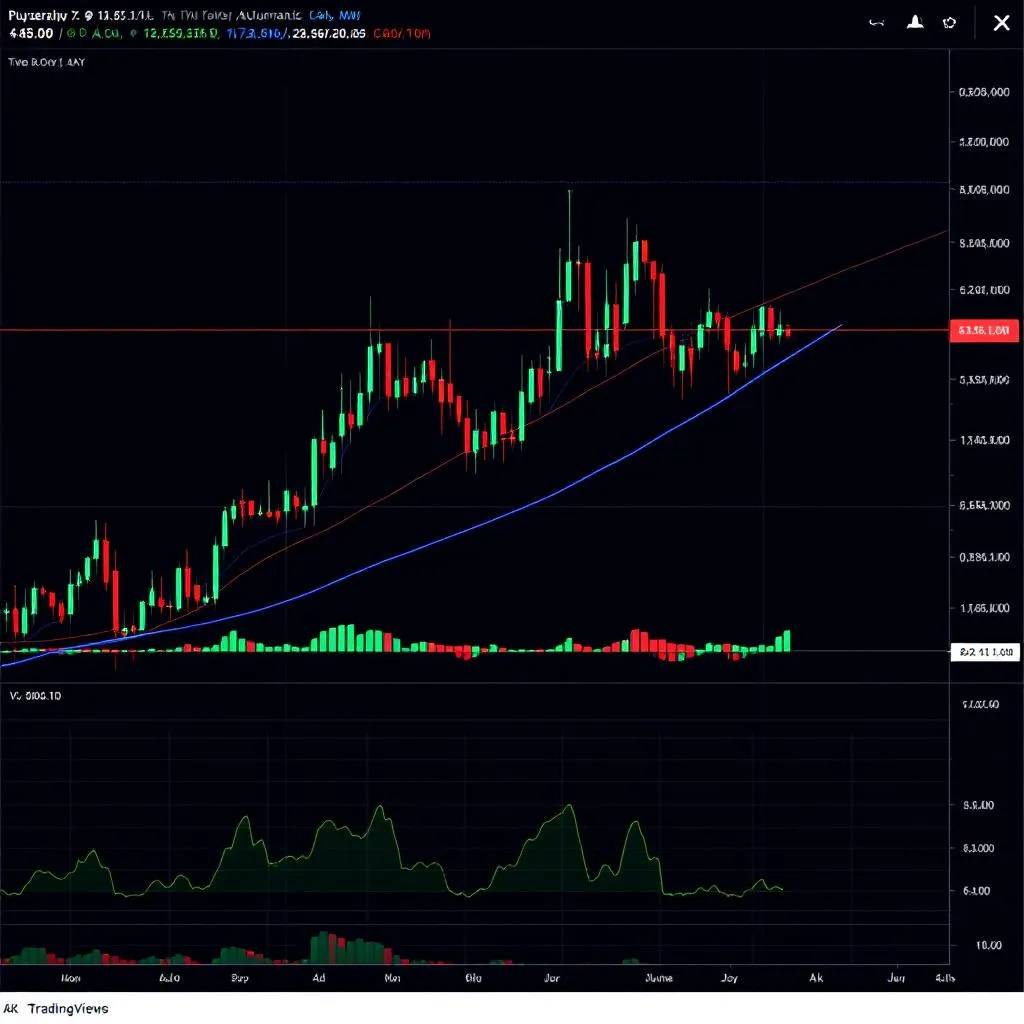
Also shows an orange line (fast MA) and blue line (slow MA). When orange crosses above blue = trend turning up. Below = turning down.
Auto Trendlines Pro
Draws lines on your chart automatically:
- Green lines — Support (price bounces UP from here)
- Red lines — Resistance (price bounces DOWN from here)
- Blue dashed lines — Horizontal levels where price bounced multiple times
Labels like "↗ rising support" or "▼ S break" tell you what's happening at each line.
Bar Analysis Report
A panel in the corner of your chart showing a live analysis of the last 5 and 10 bars. Includes:
- Direction — UP/DOWN/FLAT with percentage
- Momentum — ACCELERATING / FADING / STEADY
- Volume — RISING / FALLING / NORMAL
- Candle Patterns — Detects doji, hammer, engulfing, etc.
- Overall Bias — STRONG BULLISH to STRONG BEARISH
Smart Money Tracker
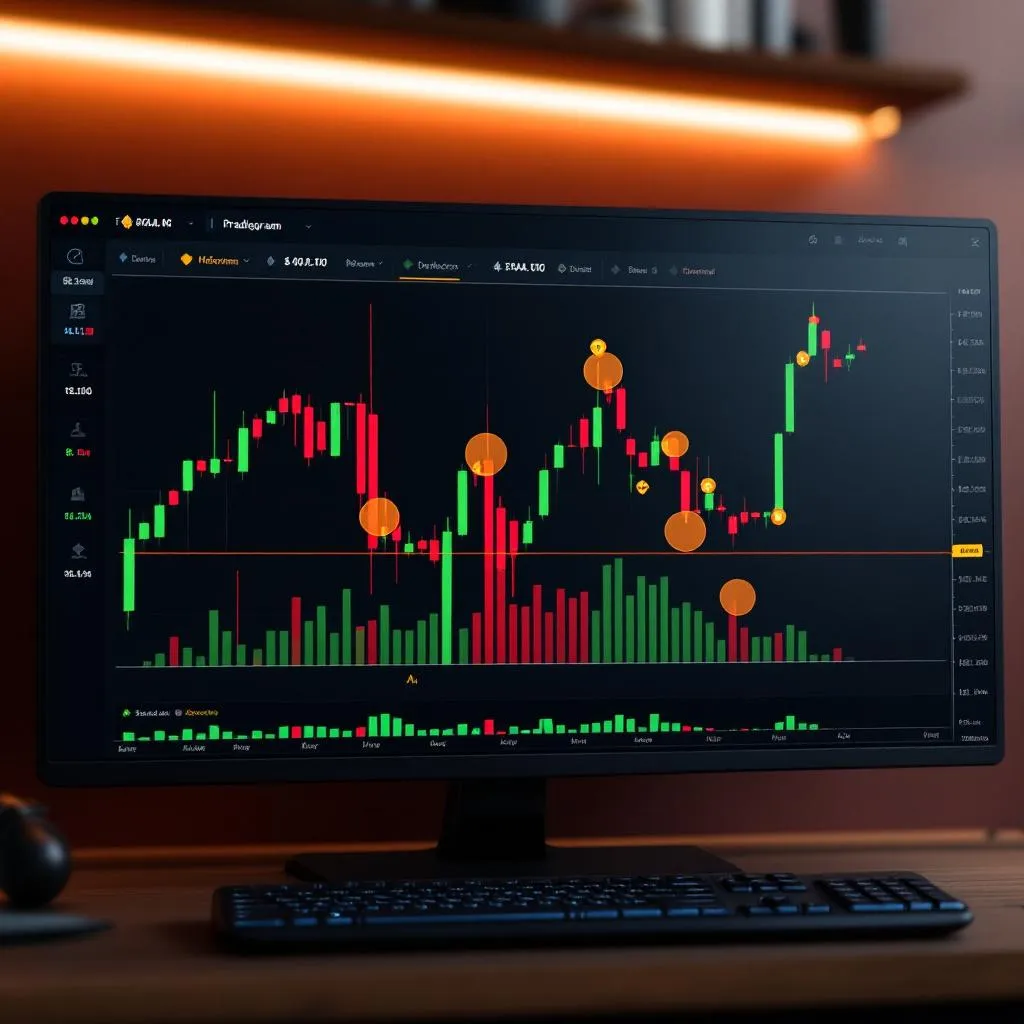
A histogram showing whale activity:
- Green bars — Whales are accumulating (buying)
- Red bars — Whales are distributing (selling)
- Yellow diamond — Volume spike, someone moved unusual size
- Orange circle — Stop hunt detected
- Green triangle up — Bullish divergence: whales buying while price drops
Volatility Regime
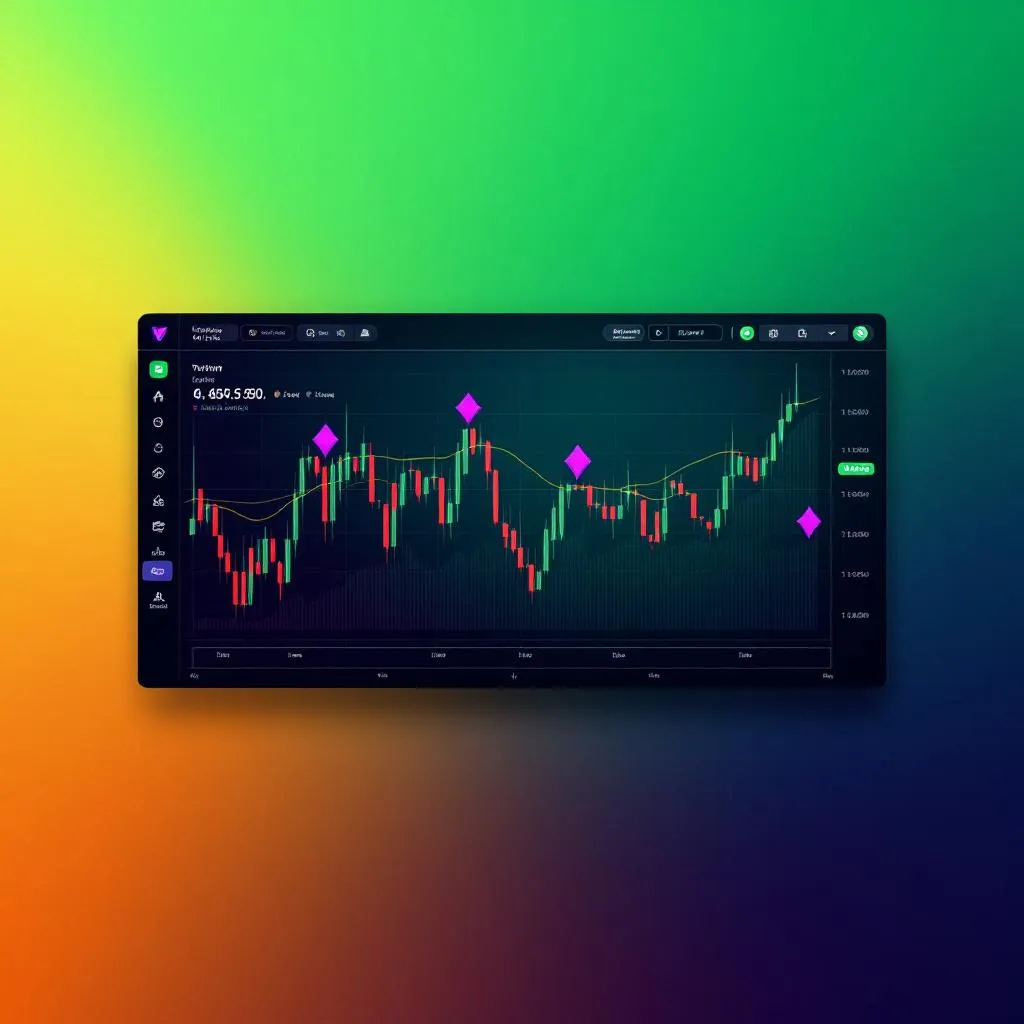
Colors your entire chart background:
- Green background — Calm. Tight stops, range trading works.
- Yellow background — Elevated. Follow momentum, wider stops.
- Red background — Extreme. Reduce size or stay out.
- Purple diamonds — Squeeze building. Big move coming.
Liquidity Trap Detector
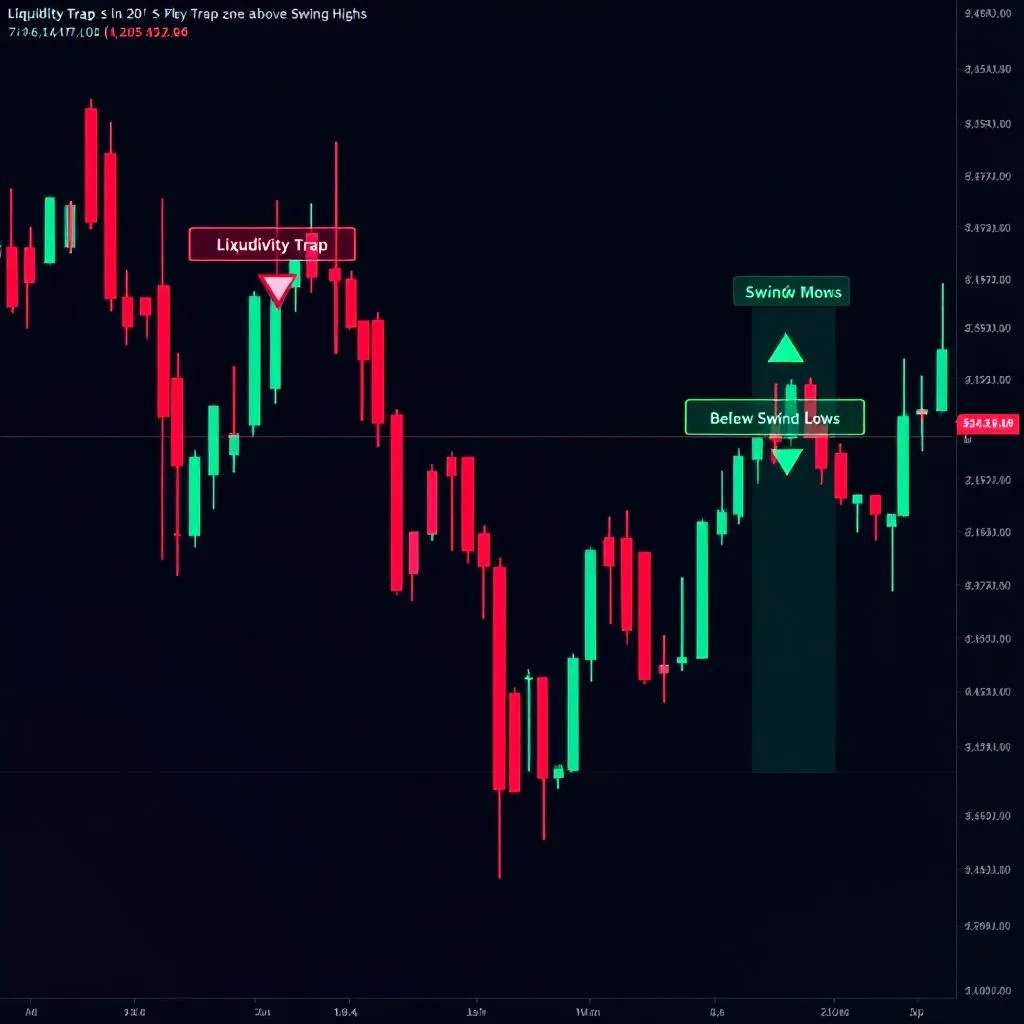
Shows where manipulation happens:
- Red boxes — Trap zones above swing highs (where shorts' stops sit)
- Green boxes — Trap zones below swing lows (where longs' stops sit)
- Green triangle ▲ — Bear trap detected — bounce opportunity!
- Red triangle ▼ — Bull trap detected — drop likely
Risk-On / Risk-Off Meter
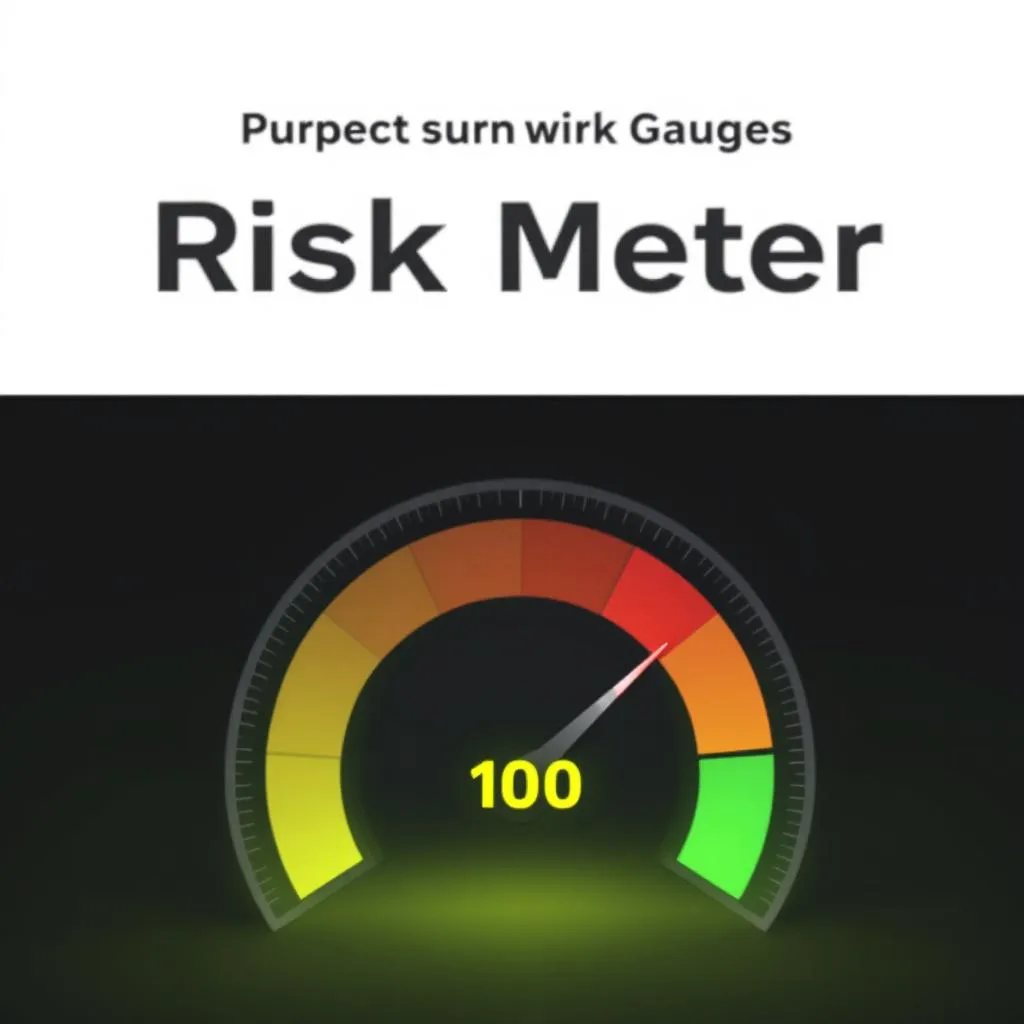
Scores market mood from -100 (fear) to +100 (greed):
- Green background — Risk-on. Confidence. Longs favored.
- Red background — Risk-off. Fear. Cash or hedge.
- Panel shows: regime, score, momentum, volume bias, and action guidance
Exhaustion & Capitulation Detector

Finds the moment a move dies:
- Red histogram — Overbought, pullback building
- Green histogram — Oversold, bounce building
- Yellow dot — Exhaustion warning
- Green diamond ◆ — Selling capitulation — your best bounce entry
- Red diamond ◆ — Buying capitulation — top likely
Your first trade with TradeOptics
Here's a simple exercise to build confidence. Don't risk real money yet — just observe.
The exercise (15 minutes)
- Open XRP/USDT on the 4h timeframe
- Add Momentum Health Check and Auto Trendlines Pro to the chart
- Add Smart Money Tracker in a pane below
- Scroll back in history and find a spot where:
- Bars turned from red to bright green
- Price was near a green support line
- Smart Money histogram was green (accumulating)
- Look at what happened NEXT — price almost certainly went up
- Now find the opposite: bright red bars + near red resistance + Smart Money distributing → price went down
When you're ready for real trades
Follow the decision tree from the cheat sheet:
- Check Risk Meter — is the market in fear or greed?
- Check Volatility — how wide should your stop be?
- Check bar colors — who's in control?
- Check Smart Money — do whales agree?
- Check trendlines — where are the key levels?
- Check for traps — is this breakout real?
- Check exhaustion — is the move dying?
- Read the Bar Analysis report — final confirmation
If 5+ indicators agree = high conviction. If fewer than 3 agree = no trade.
Questions? Email support@tradeoptics.io