Indicator Playbook
How to use each indicator, what settings to run, when to trust them, and how to combine them into a trading system.
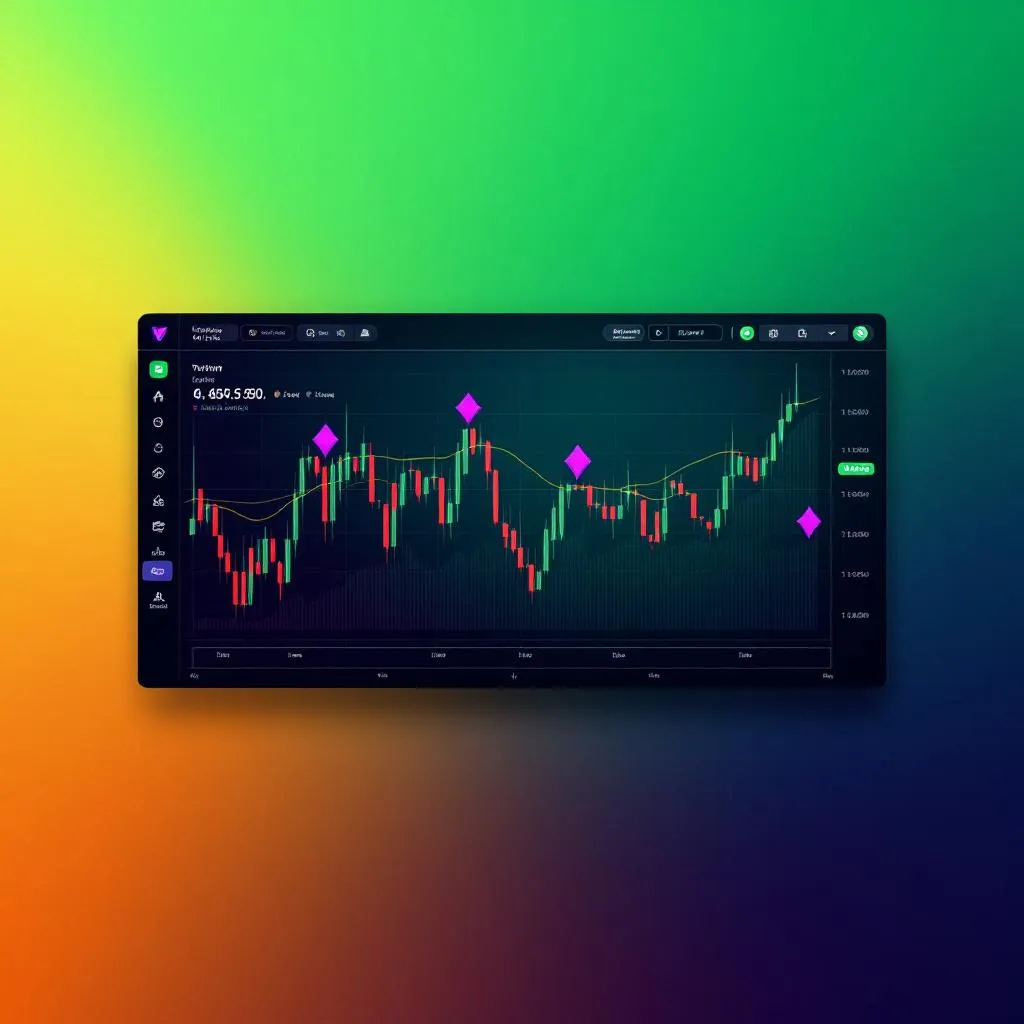
Momentum Health Check
What it does
Colors every bar on your chart based on three things: trend direction (are fast and slow moving averages aligned?), RSI momentum (who's pushing harder — buyers or sellers?), and volume (is the move backed by real participation?). One glance tells you the state of the market.
How to read it
- Bright green bar = Trend is up + RSI above 50 + volume above average. Strong bullish.
- Dim green bar = Trend is up + RSI above 50 but volume is below average. Bullish but weak — the move might not stick.
- Bright red bar = Trend is down + RSI below 50 + volume above average. Strong bearish.
- Dim red bar = Trend is down + RSI below 50 but low volume. Bearish but weak.
- Gray bar = No clear direction. RSI is near 50, MAs are tangled. No edge — don't trade.
- Orange line = Fast EMA (9). Reacts quickly.
- Blue line = Slow EMA (21). Shows the bigger trend.
- "BULL" / "BEAR" labels = The moment the fast MA crosses the slow. Trend just flipped.
Best settings
| Setting | 1h Crypto | 4h Crypto | Daily | Stocks |
|---|---|---|---|---|
| Fast MA | 9 | 9 | 12 | 12 |
| Slow MA | 21 | 21 | 26 | 26 |
| RSI Length | 14 | 14 | 14 | 14 |
| Volume Avg | 20 | 20 | 20 | 20 |
When to trust it
- Works best in trending markets. When price is making clear higher highs/lows or lower highs/lows, the bar colors are very reliable.
- Bright colors (not dim) = higher confidence. Volume confirmation is the key differentiator.
When to ignore it
- Choppy/sideways markets. You'll see lots of gray bars and rapid color switches. That's the indicator saying "there's no edge right now."
- During news events — the bars can flip from green to red in one candle. Wait for the dust to settle.
Combo plays
- + Exhaustion Detector: When you see dim red bars AND the Exhaustion gauge is at -50 or lower, a bounce is building. The selling is losing steam.
- + Auto Trendlines: Bright green bars bouncing off a support trendline = strong entry.
- + Smart Money: Green bars + Smart Money accumulating = whales agree with the trend.
Real trade example
XRP/USDT 4h chart. You see 6 consecutive bright green bars. The fast MA (orange) crossed above the slow MA (blue) 3 bars ago — a "BULL" label appeared. Volume is 1.5x average. RSI is at 62. Smart Money is showing green (accumulating). Auto Trendlines shows price just bounced off a rising support line.
Entry: Current price after the bounce off support.
Stop: Below the support trendline (use Volatility Regime's suggested stop distance).
Target: Next resistance trendline or horizontal level.
Auto Trendlines Pro
What it does
Automatically finds swing highs and lows (pivot points), connects them with trendlines, and draws horizontal levels where price has bounced multiple times. Labels every break so you know when a key level fails.
How to read it
- Green lines = Support trendlines (connecting lows). Price tends to bounce UP from these.
- Red lines = Resistance trendlines (connecting highs). Price tends to bounce DOWN from these.
- Blue dashed lines = Horizontal support/resistance. Price bounced here multiple times at the same price.
- "↗ rising support" = Higher lows. Buyers stepping in at higher prices each time. Healthy uptrend.
- "↘ falling resistance" = Lower highs. Sellers getting more aggressive. Downtrend.
- "▼ S break" = Support just broke. Price fell through a floor. More selling likely.
- "▲ R break" = Resistance just broke. Price pushed through a ceiling. Breakout.
- Level labels (STRONG/MODERATE/WEAK) = How many times price bounced at that horizontal level.
Best settings
| Setting | 1h | 4h | Daily |
|---|---|---|---|
| Pivot Strength | 3 | 5 | 5-8 |
| Lookback Bars | 60 | 100 | 150-200 |
| Max Trendlines | 6 | 6 | 4 |
| S/R Zone Tolerance | 0.4% | 0.3% | 0.3% |
Lower Pivot Strength on 1h = more trendlines (useful for short-term). Higher on daily = only the major levels.
When to trust it
- Horizontal levels with 3+ touches (MODERATE or STRONG) are the most reliable. The more times price bounced there, the more traders are watching it.
- Trendlines with wide spacing between the two pivot points are stronger than trendlines connecting pivots that are close together.
When to ignore it
- In a parabolic move (price going straight up or down), trendlines lag behind. The market is moving too fast for pivot-based lines to keep up.
- Right after a break, the first retest often works, but the second break attempt usually fails. Don't chase breaks.
Combo plays
- + Liquidity Trap: If price breaks a support line but the Trap Detector shows a bear trap (green triangle), the break is fake. Price is coming back up.
- + Momentum Health: Price bouncing off a trendline + bright green bars = the bounce is real and has momentum behind it.
- + Bar Analysis: Check the report's "Wick Pressure" — if wicks are lower-heavy near a support line, buyers are defending it.
Real trade example
FLR/USDT daily chart. Auto Trendlines drew a horizontal blue dashed line at $0.025 labeled "STRONG level (4 touches)." Price approaches this level from above. Momentum Health bars are dim red (sellers losing steam). Exhaustion shows -45 gauge (getting oversold).
Plan: Wait for price to touch $0.025 and show a bounce candle. If it bounces, buy at $0.0255. Stop at $0.024 (below the level). Target: next resistance line.
Bar Analysis Report
What it does
Shows a live panel on your chart that reads the last 5 and 10 bars like an expert would. Reports direction, momentum, volume trends, wick pressure, conviction, candlestick patterns, and gives an overall bias verdict.
How to read it
The panel has sections:
- Direction: UP/DOWN/FLAT with percentage change and green/red bar count.
- Momentum: ACCELERATING (bodies getting bigger) / FADING (bodies shrinking) / STEADY.
- Volume: RISING (more participation) / FALLING (less participation) / NORMAL.
- Wicks: UPPER-HEAVY (selling pressure) / LOWER-HEAVY (buying pressure) / BALANCED.
- Conviction: HIGH (big bodies, small wicks — traders committed) / LOW (small bodies, big wicks — indecision) / MODERATE.
- Candle Patterns: Names any detected patterns (doji, hammer, engulfing, etc.) with explanations.
- Overall Bias: The combined verdict from STRONG BULLISH to STRONG BEARISH.
Best settings
- Position: Top Right works well for most setups. Move to Bottom Left if it overlaps with other panels.
- Text Size: Small is the best balance of readability and space.
When to trust it
- The overall bias is most useful when it aligns with your other indicators. If Bar Analysis says "STRONG BULLISH" and your Momentum Health bars are bright green, that's confirmation.
- The 10-bar report is more reliable than the 5-bar for identifying genuine trends.
When to ignore it
- Right after a major news event. The last 5-10 bars may all be noise from the event, not a real trend.
- If the report says "NEUTRAL" — it's telling you there's no edge. Respect that.
Combo plays
- Use it as your final confirmation before entering a trade. Check everything else first, then read the Bar Analysis report as the last step.
- The "Candle Patterns" section works great with the Candlestick Encyclopedia — cross-reference any pattern it detects.
Real trade example
PAXG/USDT 4h. Bar Analysis 10-bar shows: Direction UP +1.8%, Momentum ACCELERATING, Volume RISING +32%, Wicks LOWER-HEAVY, Conviction HIGH, Pattern: Bullish Engulfing detected, Overall Bias: STRONG BULLISH. You see this confirmation after the Risk Meter showed risk-on and Smart Money showed accumulation. This is a high-conviction long.
Smart Money Tracker
What it does
Reads volume and price action to determine whether big players (whales, institutions) are accumulating (quietly buying) or distributing (quietly selling). Also catches manipulation events like stop hunts and absorption.
How to read it
- Green histogram = Net accumulation. Taller bars = more aggressive buying.
- Red histogram = Net distribution. Taller bars = more aggressive selling.
- Yellow diamond (top) = Volume spike. Someone just moved unusual size.
- Orange square (top) = Absorption. A whale bought (or sold) a massive amount but price barely moved — they're absorbing all the counter-pressure. This is how big players hide.
- Orange circle (bottom) = Stop hunt. Price spiked through a level (triggering stops) then reversed. Classic manipulation.
- Green triangle up = Bullish divergence. Price is making new lows but smart money is buying. The dip is being accumulated.
- Red triangle down = Bearish divergence. Price is making new highs but smart money is selling. The rally is being distributed.
- Panel: Shows current bias, score, volume status, absorption, stop hunt, and divergence.
Best settings
| Setting | 1h | 4h | Daily |
|---|---|---|---|
| A/D Lookback | 10 | 14 | 20 |
| Volume Spike Threshold | 2.0 | 2.0 | 2.0 |
| Stop Hunt Wick Ratio | 2.5 | 2.5 | 2.5 |
When to trust it
- Divergences are the highest-value signal. When price and smart money disagree, smart money wins. Always.
- Absorption events near key support/resistance levels are extremely significant. A whale absorbing sell pressure at support = they believe the level will hold.
When to ignore it
- In low-volume markets (weekends for crypto, after-hours for stocks), the readings can be noisy. Small orders look like "signals" because there's no baseline activity.
- A single green or red bar doesn't mean much. Look for sustained runs of the same color (3+ bars).
Combo plays
- + Liquidity Trap: Stop hunt on Smart Money + bear trap on Liquidity Trap = double confirmation of manipulation. Strong bounce signal.
- + Exhaustion: Smart money accumulating + exhaustion at extreme low = the bottom is likely in. Your best entry.
- + Momentum Health: If Smart Money is green but Momentum bars are still red, the accumulation is early stage. Be patient — the move hasn't started yet.
Real trade example
CRO/USDT 4h. Price dropped 12% over 3 days. Momentum bars are bright red. But Smart Money histogram just flipped green — accumulation starting. Then you see an orange circle (stop hunt) followed by a green triangle (bullish divergence). Price made a new low but smart money is buying harder than before.
Translation: Whales are loading up while retail panic-sells. This is early-stage accumulation before a reversal. Set alerts for when Momentum flips green — that's your entry.
Volatility Regime Detector
What it does
Colors your entire chart background based on the current volatility "mode" — calm, elevated, or extreme. Also detects volatility squeezes (the calm before a big move) and suggests appropriate stop-loss distances.
How to read it
- Green background = Calm regime. Tight ranges. Mean reversion works. Use tight stops.
- Yellow background = Elevated. Trends are developing. Follow momentum. Wider stops.
- Red background = Extreme. War news, liquidation cascades, political shocks. Reduce size significantly or stay out entirely.
- Purple diamonds (below bars) = Squeeze building. Volatility is compressing. A big move is coming — you don't know which direction yet.
- Orange triangle (below bars) = Squeeze just broke. The move is starting NOW.
- "→ CALM/ELEVATED/EXTREME regime" labels = Regime just changed.
- Panel: Shows current regime, vol ratio, duration (how long in this regime), ATR, suggested stop distance, squeeze status.
Best settings
| Setting | All timeframes |
|---|---|
| ATR Length | 14 |
| Calm Threshold | 0.7 |
| Extreme Threshold | 1.8 (crypto), 1.5 (stocks) |
Stocks are less volatile than crypto, so lower the extreme threshold for stocks.
When to trust it
- Regime changes are the most actionable signal. When the background flips from green to yellow, your strategy needs to change.
- Squeezes are extremely reliable. After compression, expansion almost always follows. The longer the squeeze, the bigger the move.
When to ignore it
- During the transition between regimes (first 2-3 bars after a change), the reading can oscillate. Wait for it to settle.
- The regime tells you HOW to trade, not WHAT direction. It's a context indicator, not a signal indicator.
Combo plays
- Affects every other indicator. In calm regimes, tighter stops. In extreme regimes, either widen stops 2-3x or don't trade.
- + Momentum Health: Squeeze breaking + bright green bars = enter the expansion trade with the trend.
- + Risk Meter: Extreme volatility + risk-off = cash is king. Don't be a hero.
Real trade example
BTC/USDT 1h. Background has been green (calm) for 48 bars. Purple diamonds appeared 12 bars ago — squeeze building. Then an orange triangle — squeeze breaks. Momentum bars flip bright green. Volume surges.
Action: The squeeze broke bullish. Enter long. Use the suggested stop from the panel (1.5x ATR in calm regime, but this is expanding — use 2x ATR). Target: ride the expansion until bars turn dim or gray.
Liquidity Trap Detector
What it does
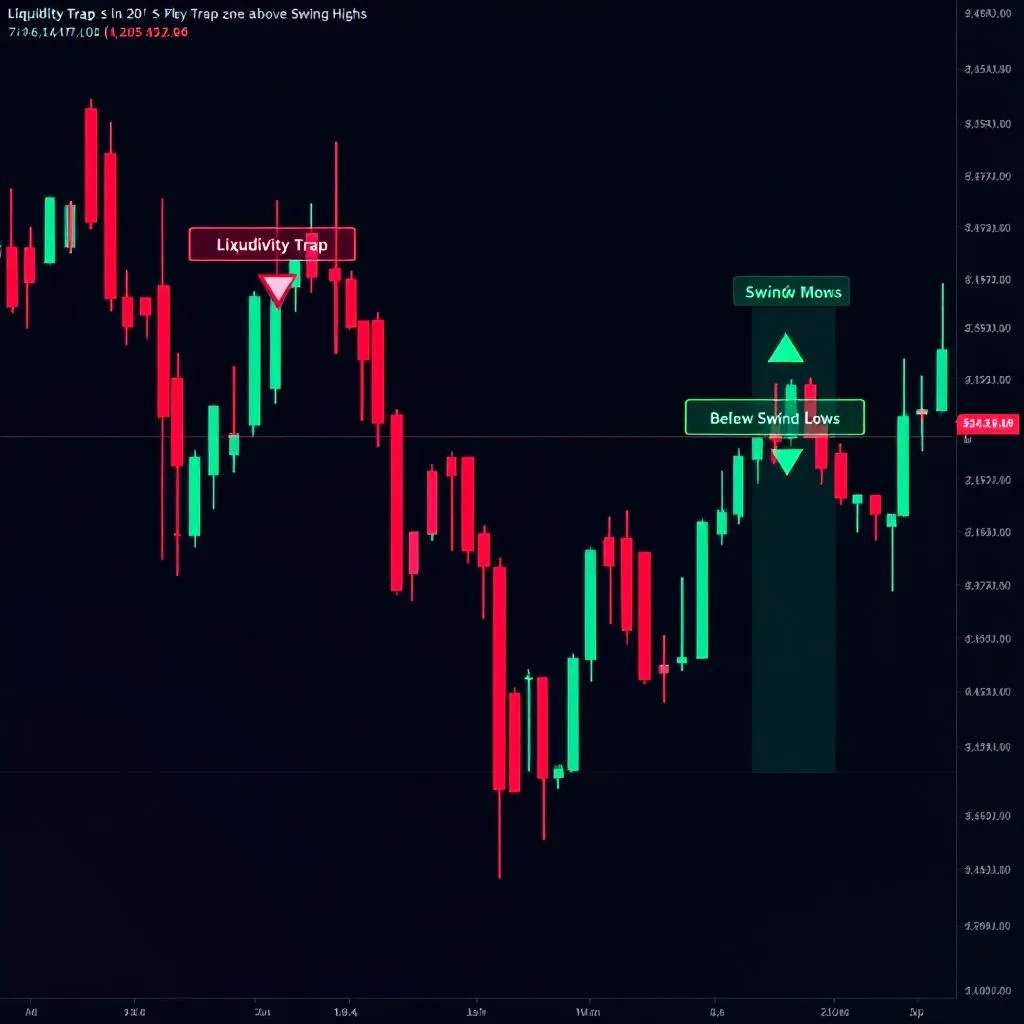
Shows you where stop-losses are clustered (liquidity zones) and detects when price spikes into those zones then reverses — the classic "trap" or "stop hunt" manipulation move.
How to read it
- Red boxes (above swing highs) = Where shorts' stop-losses sit. Whales might spike price up here to grab them.
- Green boxes (below swing lows) = Where longs' stop-losses sit. Whales might spike price down here to grab them.
- Green triangle up (below bar) = Bear trap detected. Price dipped below a swing low, grabbed stops, reversed up. This is your bounce entry.
- Red triangle down (above bar) = Bull trap detected. Price spiked above a swing high, grabbed stops, reversed down. Expect a drop.
- "trap → bounce likely" / "trap → drop likely" = Small labels explaining what just happened.
- Panel: Shows nearest trap zone above and below, distance to each, current trap status.
Best settings
| Setting | 1h | 4h | Daily |
|---|---|---|---|
| Pivot Length | 3 | 5 | 5 |
| Trap Zone Width | 0.4% | 0.3% | 0.3% |
| Min Reversal | 0.15% | 0.2% | 0.2% |
| Max Zones | 6 | 6 | 4 |
When to trust it
- Bear traps at strong horizontal support levels (from Auto Trendlines) are extremely high probability. Multiple systems confirming the same bounce.
- Traps with high volume are more reliable than traps on low volume.
When to ignore it
- Not every wick into a zone is a trap. The indicator requires the candle to close back above/below the level AND have a significant wick. But in fast markets, you might see false signals.
- On daily timeframes, traps are rarer but more significant. On 1h, they're more frequent but less reliable.
Combo plays
- + Smart Money: Bear trap + Smart Money stop hunt signal (orange circle) = double confirmation. Whales grabbed liquidity.
- + Exhaustion: Bear trap + selling capitulation (green diamond) = the strongest possible bounce signal in the entire system.
- + Auto Trendlines: Trap at a horizontal level with 3+ touches = institutional-grade entry.
Real trade example
XRP/USDT 1h. Price has been ranging between $2.10 support and $2.25 resistance. Green boxes sit below $2.10 — that's where longs have their stops. Suddenly price dips to $2.08, wicks below the green box. A green triangle appears: bear trap. Smart Money shows an orange circle: stop hunt. Price closes back at $2.11.
Entry: $2.11 (right after the trap confirms). Stop: $2.06 (below the trap wick). Target: $2.25 (resistance). Risk/reward: roughly 1:3.
Risk-On / Risk-Off Meter
What it does
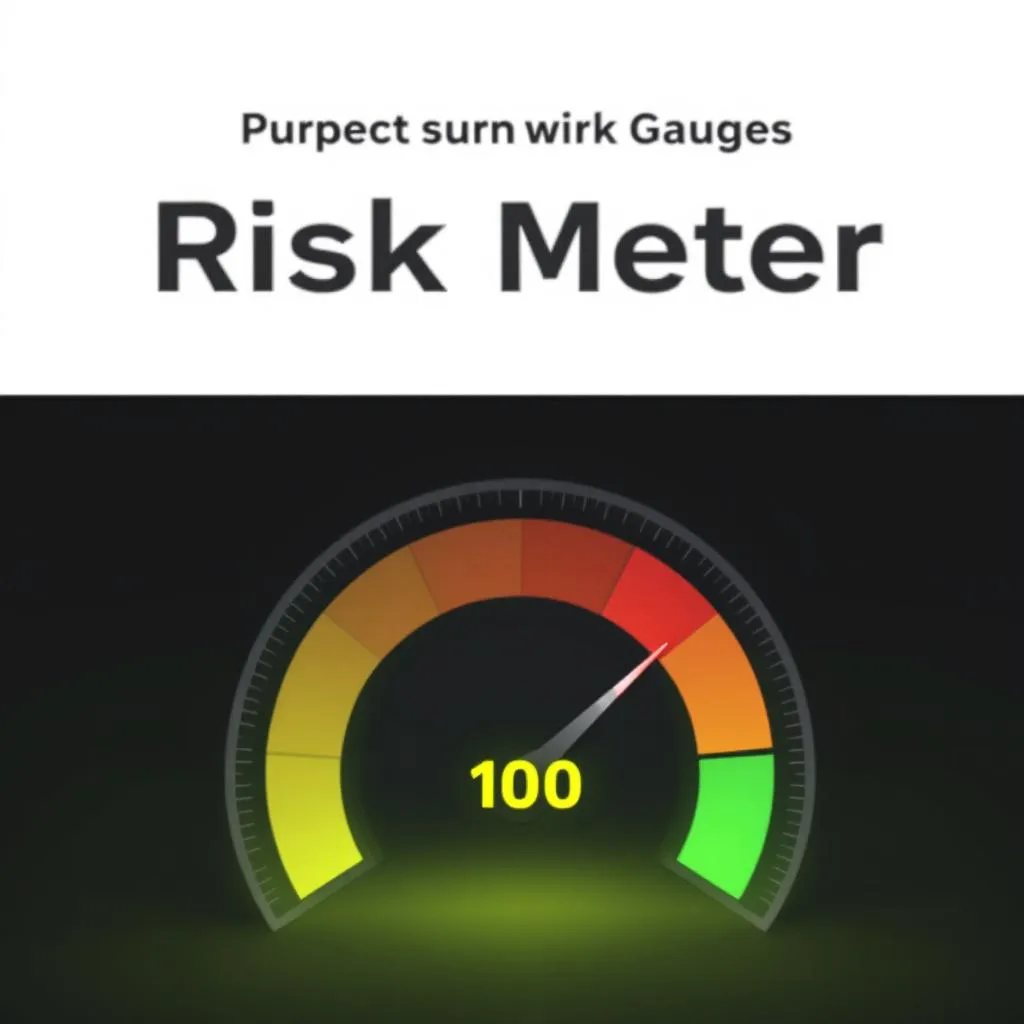
Scores the overall market mood from -100 (maximum fear) to +100 (maximum greed). Combines six signals: price momentum, volume bias, candle direction, close position, market structure, and volatility.
How to read it
- Score > +40 = Strong risk-on. Confidence high. Aggressive longs OK.
- Score +15 to +40 = Risk-on. Longs favored. Normal position size.
- Score -15 to +15 = Neutral. No clear edge. Small size or wait.
- Score -40 to -15 = Risk-off. Defensive mode. Shorts or cash.
- Score < -40 = Strong risk-off. Maximum fear. Cash or hedge. Wait for a capitulation signal.
- Background color shifts green (risk-on) to red (risk-off).
- "→ risk-on" / "→ risk-off" labels = The moment the regime flips.
- Panel: Regime, score, momentum %, volume bias, green/red bar count, volatility level, action guidance.
Best settings
| Setting | All timeframes |
|---|---|
| Analysis Lookback | 20 (default) |
Lower to 15 on 1h for faster response. Keep at 20 for 4h and daily.
When to trust it
- Regime shifts are the most important signal. When the score crosses from positive to negative (or vice versa), something changed in the market. Pay attention.
- The "Action" row in the panel is your quick-read: "Aggressive longs OK" or "Cash or hedge."
When to ignore it
- The score can lag during sudden events. A war headline can crash the market in one candle, but the 20-bar lookback takes a few bars to fully reflect it.
- Don't trade against a strong risk-off reading just because a single indicator looks bullish. Market mood > individual signals.
Combo plays
- Check this FIRST before any trade. If the market is in strong risk-off, even the best setup can fail because everything is selling together.
- + Exhaustion: Strong risk-off (-60 or lower) + selling capitulation = the fear is at maximum. This is where bounces start. But be small — catching falling knives is risky.
Real trade example
Any chart, 4h. Risk Meter shows: Score -55, Regime STRONG RISK-OFF, Action "Max fear. Cash or hedge." Everything is selling. You see a great-looking bounce setup on XRP but the Risk Meter is screaming fear.
Decision: Skip the trade or take 25% of normal size. The market mood is against you. Wait for the Risk Meter to cross back above -15 before going full size on longs.
Exhaustion & Capitulation Detector
What it does

Finds the exact moment when a move runs out of fuel. Buyers or sellers are exhausted — they've given everything and there's nobody left to push price further. The reversal is about to begin.
How to read it
- Histogram gauge = Pressure reading from -100 (extremely oversold) to +100 (extremely overbought).
- Bright red bars (gauge > +40) = Market is stretched up. Pullback building.
- Bright green bars (gauge < -40) = Market is stretched down. Bounce building.
- Yellow dot (top) = Bullish exhaustion. Buyers are tiring. Expect a pullback.
- Yellow dot (bottom) = Bearish exhaustion. Sellers are tiring. Bounce building.
- Green diamond (bottom) = SELLING CAPITULATION. Panic bottom. Everyone who was going to sell has sold. This is your A+ bounce entry.
- Red diamond (top) = BUYING CAPITULATION. Euphoric top. Everyone who was going to buy has bought. Take profits or short.
- RSI line (blue) = Standard momentum oscillator.
- MFI line (purple) = Like RSI but includes volume. More reliable for spotting capitulation.
Best settings
| Setting | All timeframes |
|---|---|
| RSI Length | 14 |
| MFI Length | 14 |
| Bullish Exhaustion RSI | 75 |
| Bearish Exhaustion RSI | 25 |
| Bullish Capitulation RSI | 85 |
| Bearish Capitulation RSI | 15 |
When to trust it
- Selling capitulation (green diamond) is the single highest-probability signal in the entire system. When RSI is below 15, MFI is below 20, volume is 2.5x+ average, and the candle is red — that's maximum panic. What follows is almost always a bounce.
- Capitulation signals at key support levels (from Auto Trendlines) or after a bear trap (from Liquidity Trap) are the strongest possible entries.
When to ignore it
- Exhaustion dots (yellow) are warnings, not entries. They say "the move is tiring" but it could tire for 10 more bars before actually reversing.
- In a strong trend, the gauge can stay extreme for extended periods. Being "overbought" doesn't mean the price can't go higher. Use exhaustion for counter-trend trades only when other indicators confirm.
Combo plays
- + Liquidity Trap: Selling capitulation + bear trap = your best bounce setup. Period.
- + Smart Money: Capitulation + smart money accumulating = the bottom is confirmed by whale behavior.
- + Volatility Regime: Capitulation during extreme volatility regime = the panic is real and the bounce will be violent (in a good way, if you're long).
Real trade example
NEXO/USDT 4h. Price dropped 18% in two days. Red bars everywhere. Then: Exhaustion gauge hits -72. RSI at 13. MFI at 17. Volume is 3.1x average. A massive red candle forms — and a green diamond appears. Selling capitulation.
At the same time: Liquidity Trap shows a bear trap (green triangle). Smart Money shows a stop hunt (orange circle) + bullish divergence. Auto Trendlines shows price hit a STRONG horizontal level.
This is the full stack signal. Entry at the close of the capitulation candle. Stop below the wick. Target: the previous resistance level. This type of setup has the highest probability in the entire system.
The Full Stack Setup
Chart Layout
Main chart (top, ~60% of screen):
- Momentum Health Check (bar colors)
- Auto Trendlines Pro (support/resistance lines)
- Liquidity Trap Detector (zone boxes + trap markers)
- Volatility Regime (background color)
- Risk-On/Risk-Off Meter (panel in Top Left)
- Bar Analysis Report (panel in Top Right)
Lower pane 1 (~20%):
- Smart Money Tracker (histogram)
Lower pane 2 (~20%):
- Exhaustion Detector (histogram + RSI/MFI)
The Scanning Process
Every time you sit down to trade, run this sequence:
- What's the market mood? → Check Risk Meter. If strong risk-off, be defensive.
- What's the volatility? → Check background color. Adjust your stop distance and size.
- What's the trend? → Check bar colors. Green = bullish, red = bearish, gray = no edge.
- What are the whales doing? → Check Smart Money histogram. Accumulating or distributing?
- Where are the key levels? → Check trendlines and horizontal levels. Where would you buy? Where would you sell?
- Is anyone being manipulated? → Check for trap zones and recent trap signals.
- Is the move dying? → Check Exhaustion gauge. Any capitulation signals?
- Final check. → Read the Bar Analysis panel. Does everything agree?
The Decision Flowchart
Is Risk Meter risk-on? ──→ NO ──→ Reduce size or wait.
        │ YES
        ↓
Is volatility calm or elevated? ──→ EXTREME ──→ Widen stops 3x or skip.
        │ YES
        ↓
Are bars green (for longs) or red (for shorts)?
        │ YES
        ↓
Is Smart Money confirming? ──→ NO ──→ Proceed with caution, half size.
        │ YES
        ↓
Is price near a key level? ──→ NOT NEAR ──→ Wait for better entry.
        │ YES
        ↓
Any trap or exhaustion signal? ──→ YES ──→ High conviction. Full size.
        │ NO
        ↓
Moderate conviction. Normal size.
Position Sizing by Signal Count
- 6-8 indicators agree: Full position. High conviction.
- 4-5 agree: 50-75% of normal size.
- 2-3 agree: 25% size or paper trade it.
- <2 agree: No trade. Wait for a better setup.
The best trades are the ones where everything lines up. When you see smart money accumulating at a key support level with a bear trap and selling capitulation — and the Risk Meter is risk-on with calm volatility — that's the trade you take with full conviction. Those don't happen every day. But when they do, you want to be ready.
Questions? Email support@tradeoptics.io