Pre-Built TradingView Layouts
Three optimized chart layouts for different trading styles. Set up your chart following the instructions below, then save it as a layout in TradingView.
Crypto Scalp / Short-Term (1h – 4h)
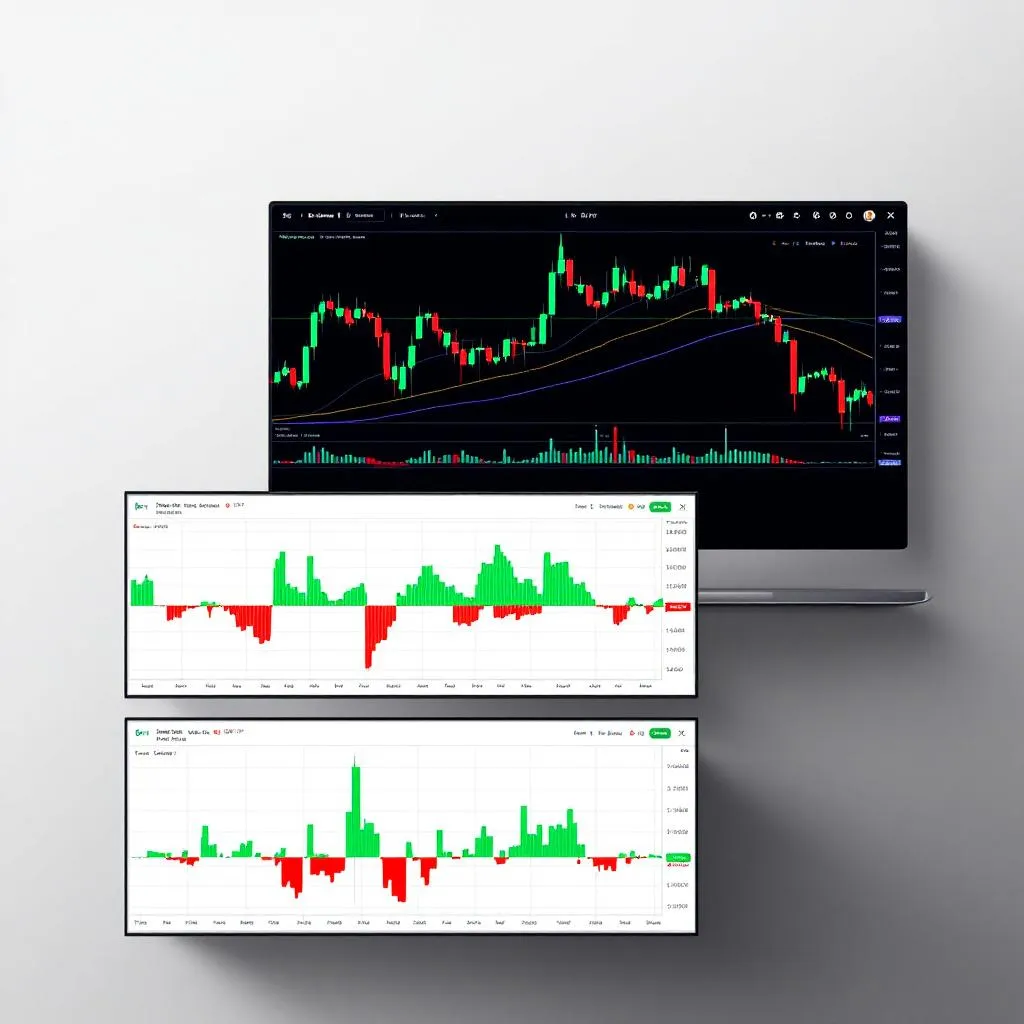
Purpose: Quick entries and exits on crypto pairs. Focused on catching bounces, traps, and momentum shifts in real time.
Price chart overlays
Add these indicators to the price chart:
- Momentum Health Check — bar colors tell you who's in control
- Auto Trendlines Pro — auto-draws support/resistance + labels breaks
- Liquidity Trap Detector — shows trap zones + marks fake breakouts
- Volatility Regime — background color shows calm/elevated/extreme
Settings to adjust:
- Momentum Health: Fast MA = 9, Slow MA = 21 (default, good for 1h–4h)
- Auto Trendlines: Pivot Strength = 3 (lower for more lines on short timeframes)
- Liquidity Trap: Pivot Length = 3, Trap Zone Width = 0.4%
- Volatility Regime: ATR Length = 14 (default)
Smart Money Tracker
Histogram showing accumulation/distribution.
Exhaustion Detector
Histogram + RSI/MFI lines.
Table indicators
- Bar Analysis Report — table in Top Right position
- Risk-On / Risk-Off Meter — table in Top Left position
How to scan for a trade
- Glance at background color (volatility regime) — if extreme, reduce size
- Check bar colors — bright green = momentum with you
- Look for a trap triangle near a trendline = high-probability bounce
- Confirm with Smart Money histogram (should be green/accumulating)
- Check exhaustion — is the seller move dying? Perfect.
- Read the Bar Analysis panel — does it agree?
- Execute.
Swing Trading (4h – Daily)
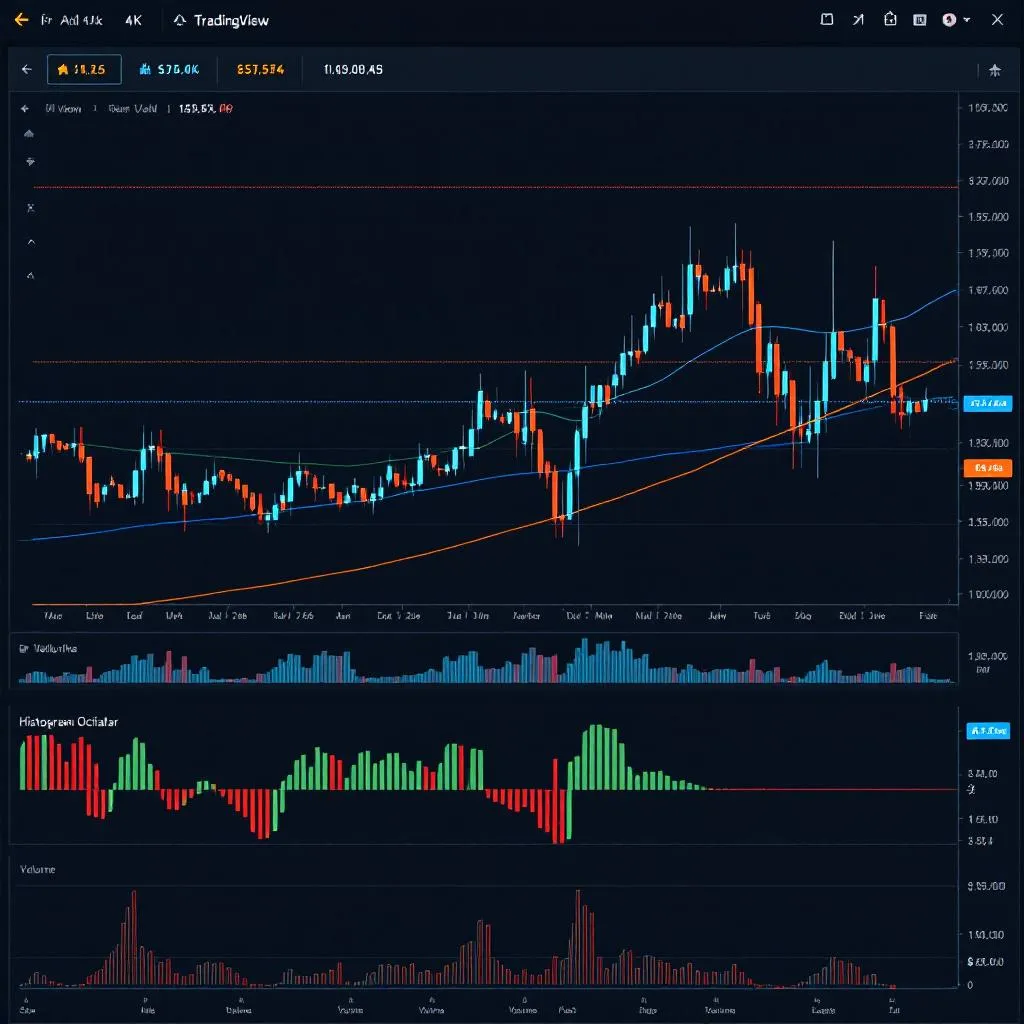
Purpose: Holding trades for days to weeks. Focused on trend direction, smart money positioning, and regime awareness.
Price chart overlays
- Momentum Health Check — Settings: Fast MA = 12, Slow MA = 26 (wider for daily)
- Auto Trendlines Pro — Pivot Strength = 5 (default, good for daily)
- Risk-On / Risk-Off Meter — background shifts green/red with sentiment
Smart Money Tracker
Your most important indicator on swing trades. Follow the whales.
Volatility Regime
Separate pane so you can see the squeeze diamonds clearly.
Bar Analysis Report
Top Right, set to show 10-bar focus.
Key differences from scalp layout
- No Liquidity Trap (traps are less relevant on daily — you're not scalping the bounce)
- Risk Meter on main chart (sentiment matters more on swing)
- Wider MA settings (less noise on higher timeframes)
- Smart Money is king — if whales are accumulating on daily, the trend is your friend
Long-Term / Buy & Hold Analysis (Daily – Weekly)
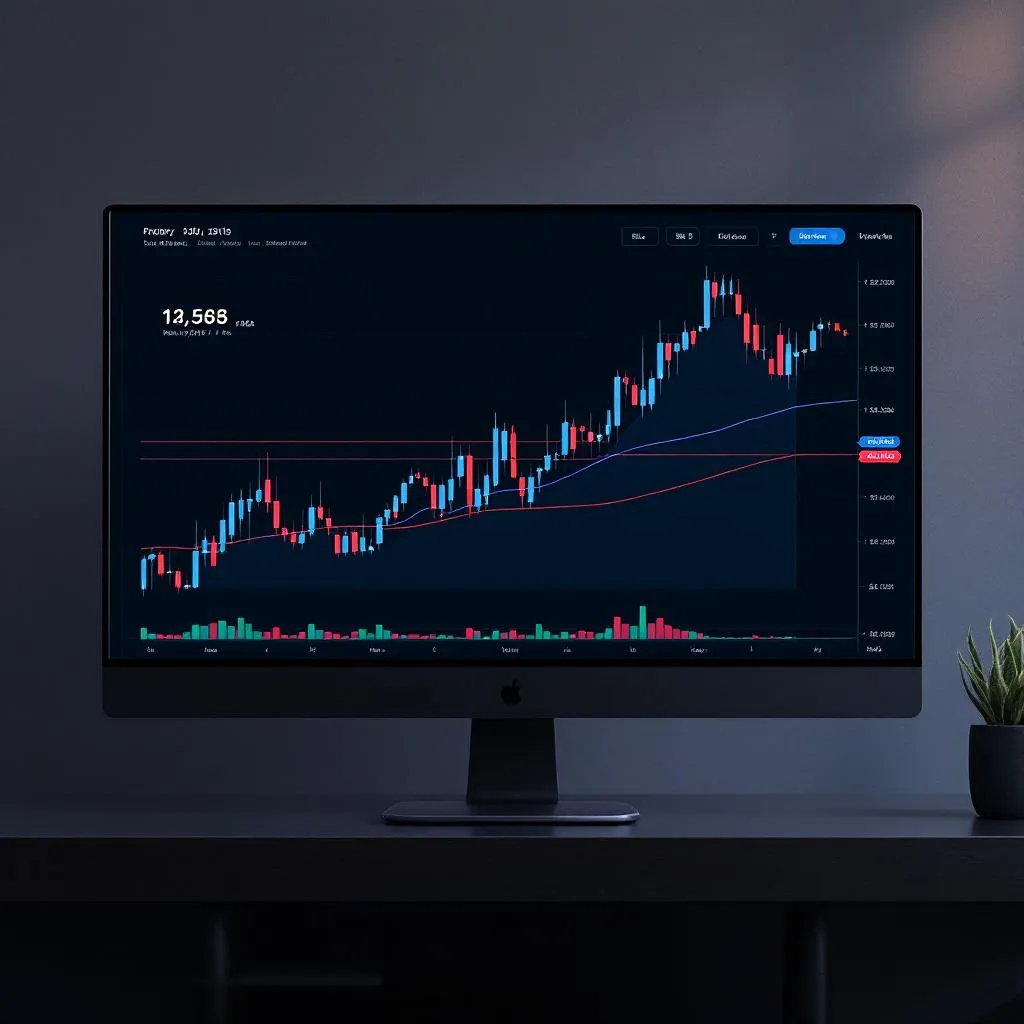
Purpose: Evaluating tokens for portfolio positions. "Should I buy this and hold it for months?" Focus on big-picture trend, smart money, and regime.
Price chart overlays
- Momentum Health Check — Settings: Fast MA = 21, Slow MA = 50 (long-term)
- Auto Trendlines Pro — Pivot Strength = 8, Lookback = 200 (major levels only)
- Volatility Regime — background shows the big picture: calm accumulation phase or chaos?
Lower pane tabs
- Tab 1: Smart Money Tracker — is this token being accumulated or distributed over weeks?
- Tab 2: Exhaustion Detector — is the long-term downtrend exhausted? Buy signal.
Bar Analysis Report
10-bar report on daily/weekly tells you the macro story.
How to evaluate a token
- Is the Volatility Regime calm? (Good — accumulation happens in calm periods)
- Is Smart Money accumulating? (The most important signal for long-term holds)
- Are the long-term MAs crossing bullish? (Trend confirmation)
- Is the Exhaustion Detector showing the downtrend is dying? (Bottom fishing)
- Is price near a major Auto Trendline support? (Good entry level)
If 4–5 of these are yes → strong buy candidate.
If 2–3 → watchlist, wait for more confirmation.
If 0–1 → skip it.
How to Save These Layouts in TradingView
- Set up your chart following the instructions above
- Click the layout dropdown (top-right, next to your layout name)
- Click "Save Layout As..."
- Name it: "SD Scalp", "SD Swing", or "SD Long-Term"
- You can switch between them instantly from the dropdown
Questions? Email support@tradeoptics.io